Data Analytics for Project and Portfolio Estimates
We live in a multi-dimensional world. We see in three dimensions. Our brains’ ability to process spatial relations of height, width, and depth are essential for navigating everywhere we go and every task we perform. The scientific world has used computers and data to generate 3D graphics for years, because it is the only way to understand complex phenomenon and ideas. I remember the first 3D color seismic map of rock formations underground I saw. The image told a story the numbers alone could not. The business world has caught on in recent years. The wave began with data warehousing and business intelligence and has grown to include data analytics, artificial intelligence, and machine learning.
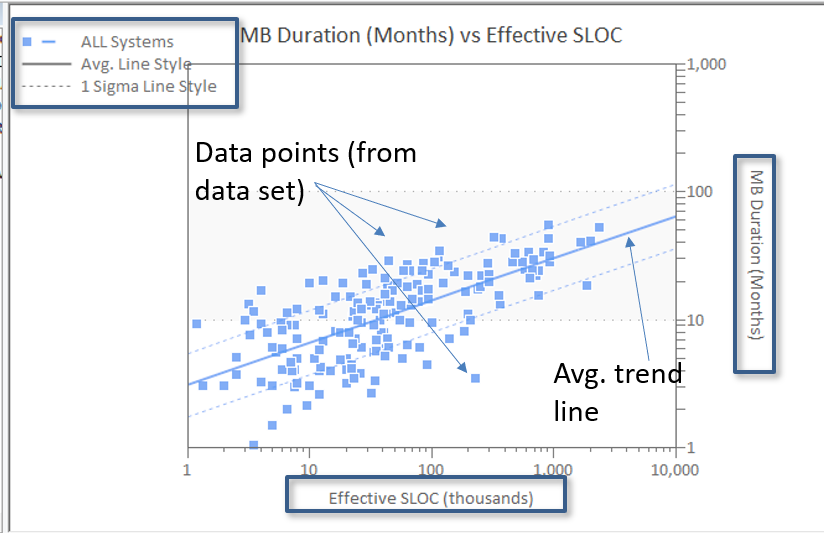
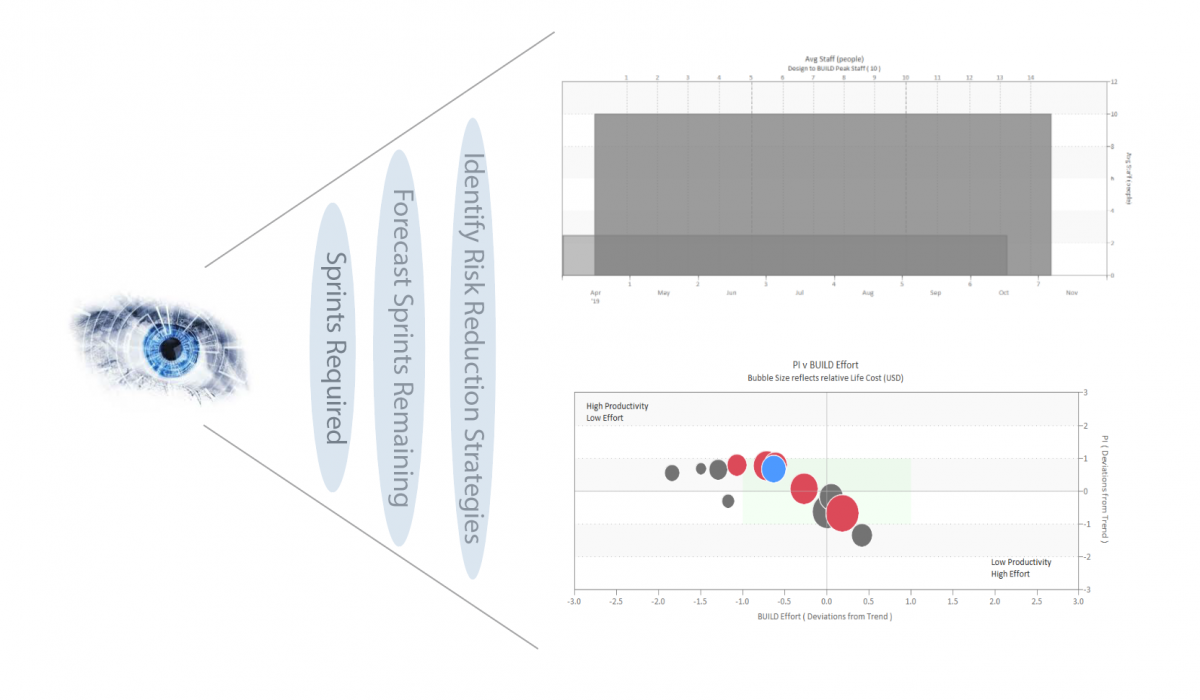
QSM has brought a scientific approach to software development project estimation and management for over 40 years. Our SLIM-Suite of tools contain statistics on the largest repository of completed software projects that enable you to model software projects to predict potential outcomes and assess the reasonableness of your estimates and project goals. They have always provided four common types of Data Analytics1 – Descriptive, Diagnostic, Predictive, and Prescriptive. SLIM tools now provide more in-depth data analytics using quadrant charts.