Productivity

Productivity

Circa 2021, What Does a “Typical” Software Project Look Like?

Background

No two software projects are exactly alike. So, one way to find out what a “typical” software project looks like is to take a large sample of completed projects from the QSM historical database of over 13,000 completed software projects and look at measurements of central tendency for staff, effort, size, schedule duration, and productivity.

For this study, QSM looked at validated projects that completed beginning in 2010. We eliminated 1 person projects and those that expended less than 1 person month of effort. The eliminated projects accounted for 13% of the sample. About 80% of the projects fell into the Business IT application domain, many of which were from the financial services sector. This domain includes projects that typically automate common business functions such as payroll, financial transactions, personnel, order entry, inventory management, materials handling, warranty and maintenance products. We determined both a median and an average for each metric. With the exception of schedule (project duration), these differed significantly which indicates that that the sample metric values were not normally distributed. To minimize the effect of unrepresentative projects (those that comprise a small part of the sample, but whose metric values are very large or very small), we decided to use the medians – values with 50% of the projects above and 50% below the “average” as a better measure of central tendency.

The "Typical" Project

Metric

Median

Average Staff (Full Time Equivalent)

4.87

White Paper: Long Term Trends from 40 Years of Completed Software Project Data

Software Project Size over Time

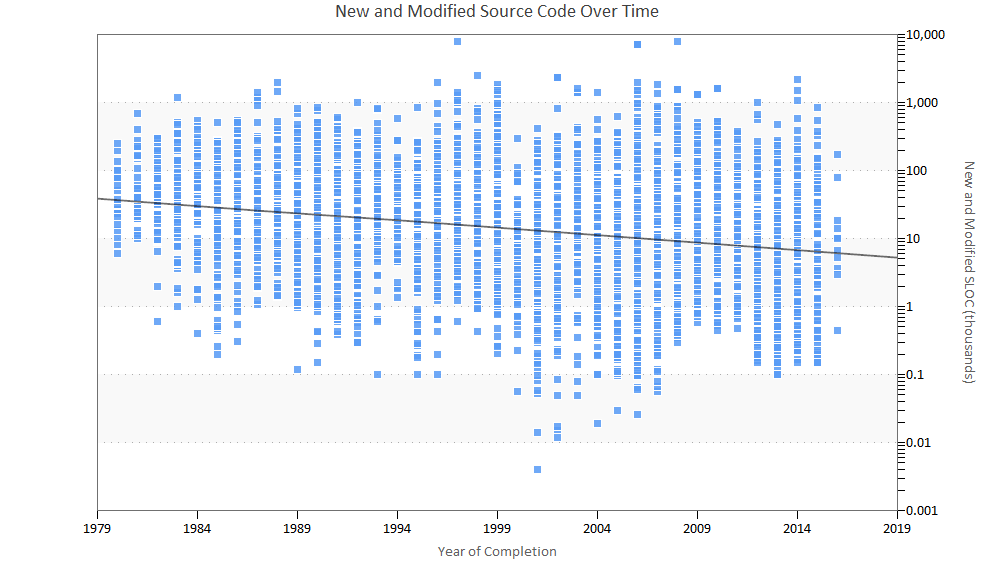
Although the software industry is known for growth and change, one thing has remained constant: the struggle to reduce cost, improve time to market, increase quality and maintainability, and allocate resources most efficiently. So how can we combat future challenges in a world where everything is software, from the systems in your car to the thermostat in your home to the small computer in your pocket? By using practical measurement and metrics, we can get a bird's-eye view of where we've been and where we could go, while keeping us grounded in data. Leveraging QSM's industry database of over 13,000+ completed projects, Katie Costantini takes a high-level look at changes to software schedules, effort/cost, productivity, size, and reliability metrics from 1980 to 2019. The current study compares insights to similar studies QSM has completed at regular intervals over the past four decades and answers questions like, 'what is the "typical" project over time?' and 'why are projects "shrinking?"' The results may surprise you!

Read the full white paper!

Are Your Software Projects Too Small?

We hear a lot about software projects that are too large or attempt to do too much in too short of a time.  They are very visible and negatively impact both budgets and careers in a not positive manner when they fail.  Small projects may fly under the radar.  This is a mistake.  Most IT projects aren’t large undertakings like Healthcare.gov; rather, they are enhancements and customizations to already existing software systems and account for the majority of most enterprises’ software budget.  Planning these projects to be optimally productive is an area in which most companies can realize the greatest returns.

How do you know what is the optimal amount of software to develop in a project?  In a newly published software benchmark study QSM analyzed productivity, cost/effort, and time to market of a large sample (over 600) of business IT projects that have recently completed.  The projects were divided into quartiles based on the amount of software they developed or customized, which were then compared to each other.  Fully ¼ of the projects were smaller than 3,200 implementation units in size or 68 function points for projects that used that size measure.  Projects in this quartile had a median productivity of 200 IU per staff month or 5 function points per staff month.  The median duration of these projects was slightly more than 3 months. The second quartile contained projects from 3,200 IU up to 8,000 (or 69 to 149 function points).  These projects had a median productivity of 377 IU per staff month (or 7.62 function point per staff month) and lasted a little more than 5 months.  This is a productivity improvement of 89%.  The smaller projects were markedly less productive.  So, simply by bundling software work into larger packages there are significant efficiencies to be gained.

Blog Post Categories 
Estimation Sizing Productivity

Derived PI: Is PI from Peak Staff “Good Enough”?

Are you having a hard time collecting total effort for SLIM Phase 3 on a completed project?

Can you get a good handle on the peak staff?

Maybe we can still determine PI!

It is difficult and often time consuming to collect historical metrics on completed software projects.  However, some metrics are commonly easier to collect than others, namely, peak staff, start and end dates of Phase 3 and the size of the completed project.  Asking these questions can get things started:

  • So, how many people did you have at the peak? 
  • When did you start design and when was integration testing done?
  • Can we measure the size of the software?

That gives us the minimum set of metrics to dig up.

However, the PI (Productivity Index) formula also requires phase 3 effort.  Can we use SLIM to generate a PI that is useful, using peak staff instead of total effort?

A statistical test on historical metrics can answer this question.

What are we comparing?

  • Projects used in this study had all 4 of the following:  actual reported effort; size; peak staff; duration.
  • For each project, a derived effort is generated from peak staff, size and duration. 
  • A derived PI is generated from the derived effort, size and duration.  This derived PI is then compared to the actual PI.

Definitions for terms:

Blog Post Categories 
Productivity

New Article: Measuring Effort and Productivity of Agile Projects

Agile Effort

QSM recently published the seventh and final article in the QSM Agile Round Table series. The QSM Agile Round Table was formed to discuss the role of estimation in agile environments. QSM customers shared their questions, challenges, and experiences on the relevance and benefits of scope-based estimation in an agile environment. Participants had several questions about measuring effort and productivity, and whether there are special issues around how to define and collect these metrics in an agile environment. In this article, Andy Berner identifies best practices for measuring effort and productivity in agile and discusses how the two are related.

Read the article!

Blog Post Categories 
Articles Agile Productivity Effort

Bringing Measurement to Agile

Executive teams and your end clients always want to know, “how good are our development teams?”  Agile development teams usually promise that they can deliver faster and cheaper with better quality.  But how do you truly know this is the case?  The only way to really know is to apply quantitative measurement to agile.  With the SLIM solution you can look at a completed agile project and determine the productivity that was demonstrated.  This productivity metric encompasses all environmental factors, such as how good is the skill level and experience of your development team?  How good are the tools and methodology in place?  What is the technical complexity of the software you are building? 

Blog Post Categories 
Agile Database Productivity

Can We Increase IT Productivity by Leveraging Predictive Analytics?

Often within technology organizations there is a general belief that increasing staff increases the amount of production. But what if there were better options? Wouldn’t it be great to see some additional management options using predictive analytics? This type of analysis could save organizations millions of dollars by showing how to hit their goals by just planning more effectively.

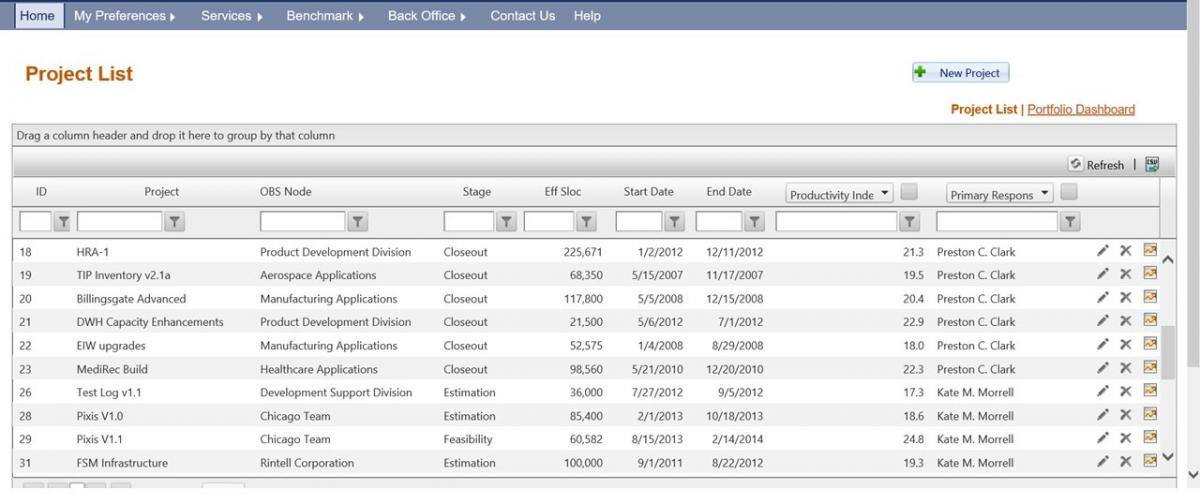
Where do you start? First, we recommend centralizing your project data so your information can be easily accessed. These projects can be completed, in-progress, or getting ready to start. The best way to do this is with a tool that lets you store the data and that also lets you generate the forecasts, all in one convenient place.

Software Project Portfolio

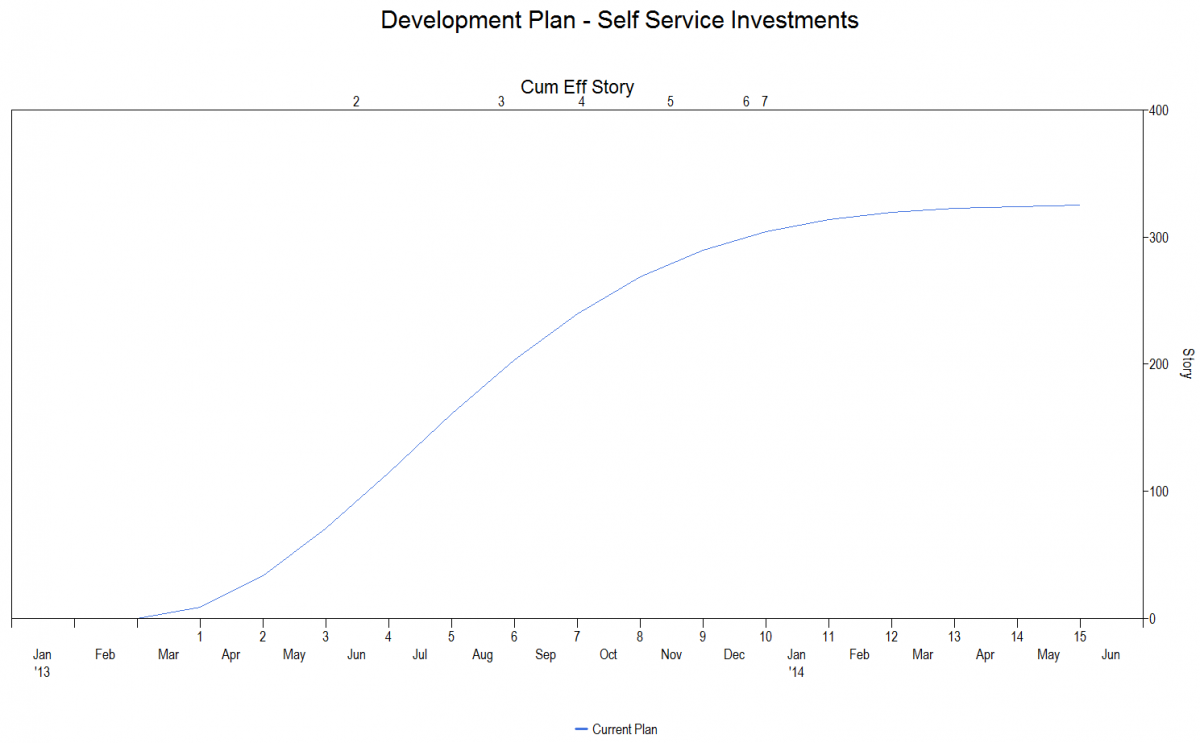
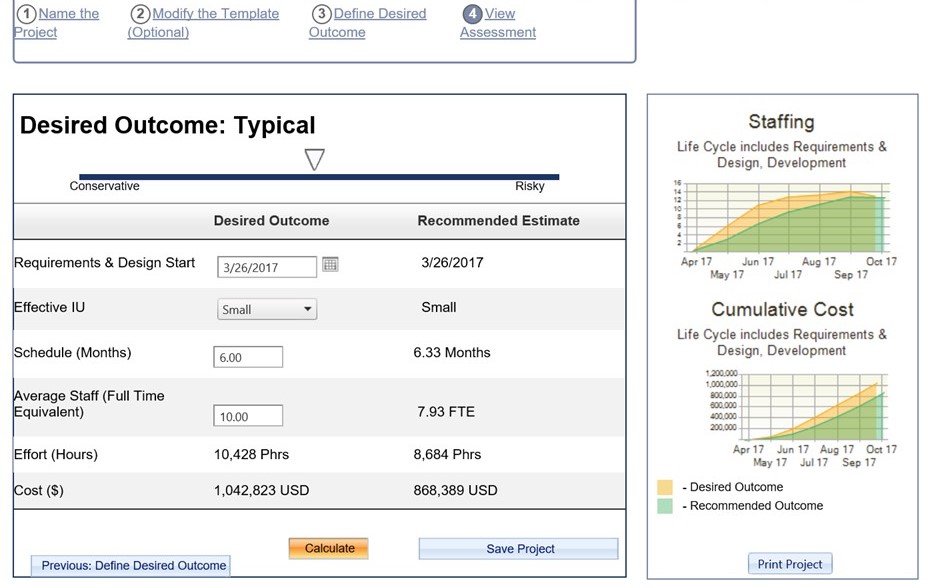
The next step would be to run built-in forecasting models to see if you can complete the required amount of work with the existing number of resources.  These models also provide other options to consider, like adjusting the number of resources on a software release or extending a project schedule to save money. The best models are empirically-based and time-tested. To generate the analysis, you need to enter some basic project level goals and the models then leverage historical data to forecast a reliable duration, effort, cost, and staffing assessment for each release.

Software Project Data

Blog Post Categories 
Productivity Portfolio Analysis

What do Sports and Agile Software Productivity Have in Common?

I am a big sports fan and since I work for a software metrics company, I started thinking about the similarities in productivity measurement in both industries. From draft picks to game planning decisions, managers in sports measure their team’s productivity to help them make better decisions in the future. Software executives and product owners do the same thing; they measure productivity in order to make better planning decisions regarding upcoming projects.

To measure productivity in baseball, we look at measures like batting average, on-base percentage, slugging percentage, and earned run average. When measuring the productivity of agile software projects, we often look at the velocity, which takes into account the number of user stories completed in each sprint. This type of historical data helps us plan effectively at the detailed level.

As part of our work at QSM, we are often asked to provide plans at the release and portfolio level. To provide these plans reliably, we use a macro level, empirically-based productivity measure that encapsulates a number of project-related factors. This measure is called the Productivity Index, an integral part of the Putnam Model.  Also known as the SLIM Model, the Putnam Model was invented by Larry Putnam Sr. almost 40 years ago and is having a big impact on software measurement more than ever today.

Once we know the total number of user stories (or any size measure), the release level effort, and the duration, we can calculate the Productivity Index of a project. The Productivity Index also takes into account the project environment including: the experience level of the team, the complexity of the software, and the quality of the tools and methods being used on the project.

Blog Post Categories 
Productivity Agile

QSM Named One of 20 Most Promising Productivity Tools Solution Providers by CIO Review

CIO Review Top Productivity Tools

QSM is pleased to announce we have recently been selected as one of the 20 Most Promising Productivity Tools Solution Providers by CIO Review. In the last few months, CIO Review has analyzed hundreds of productivity tools solution providers and shortlisted the companies that are at the forefront of tackling challenges in the arena. A distinguished panel comprising of CEOs, CIOs and analysts including CIO Review’s editorial board has selected the final list of Productivity Tools Solution Provider of 2015. In their selection process, they looked at the vendor’s capability to fulfill the need for cost-effective and flexible solutions that add value to the productivity tools landscape.

QSM establishes a productivity baseline for its customers’ projects, identifying immediate opportunities for improvement, while providing the ability to measure the return-on-investment (ROI) once those improvements have been implemented. QSM's Software Lifecycle Management (SLIM) tools support better decision making at each stage of the project development lifecycle.

Read the full report.

Blog Post Categories 
Productivity QSM News

How Can We Fix the Disconnect Between Software Vendors and Their Clients?

QSM is a leading demand and vendor management company. We have many years of experience working with outsource management professionals, evaluating software project vendor bids and monitoring the development progress of those bids for our clients. We are often hired to help them with their vendor management process because their past projects have failed to meet cost, effort, reliability, and duration expectations. 

It starts with the independent estimate and bid evaluation process. Our main clients are CIOs, PMO managers, purchasing managers, software project managers, and business stakeholders. Our clients will usually have a large software development or package configuration project pending. They are initially trying to figure out which vendor to hire. Vendor A will offer them a bid of 20 million dollars with a specified duration commitment and Vendor B will offer them a bid of 30 million dollars with a different duration commitment. How do we know which vendor to choose? Can Vendor A really finish with a lower cost and shorter schedule? Is the system going to work when it’s done?

The way it usually works is the client will make a decision based on their experience or gut feel. Or if they have already worked with a specific vendor in the past they will go with that vendor again based on some personal relationships that have evolved. Then the problems start. The work that was promised doesn’t get done within the promised time or the promised budget. The vendor then comes back and says they will add people to the project and everything will be ok. The client approves the revised project plan since they don’t have a way to confirm the accuracy of the revised proposal. Then even bigger problems start. More money is wasted, the schedule slips even more, and relationships sour.