Are you having a hard time collecting total effort for SLIM Phase 3 on a completed project?
Can you get a good handle on the peak staff?
Maybe we can still determine PI!
It is difficult and often time consuming to collect historical metrics on completed software projects. However, some metrics are commonly easier to collect than others, namely, peak staff, start and end dates of Phase 3 and the size of the completed project. Asking these questions can get things started:
- So, how many people did you have at the peak?
- When did you start design and when was integration testing done?
- Can we measure the size of the software?
That gives us the minimum set of metrics to dig up.
However, the PI (Productivity Index) formula also requires phase 3 effort. Can we use SLIM to generate a PI that is useful, using peak staff instead of total effort?
A statistical test on historical metrics can answer this question.
What are we comparing?
- Projects used in this study had all 4 of the following: actual reported effort; size; peak staff; duration.
- For each project, a derived effort is generated from peak staff, size and duration.
- A derived PI is generated from the derived effort, size and duration. This derived PI is then compared to the actual PI.
Definitions for terms:
- Derived PI is estimated PI from the reported size, duration and peak staff, using SLIM-Estimate to do a “solve for PI” to fit a Rayleigh Curve to the duration and peak staff thereby generating a derived total effort.
- PI is the actual PI calculated by SLIM-DataManager.
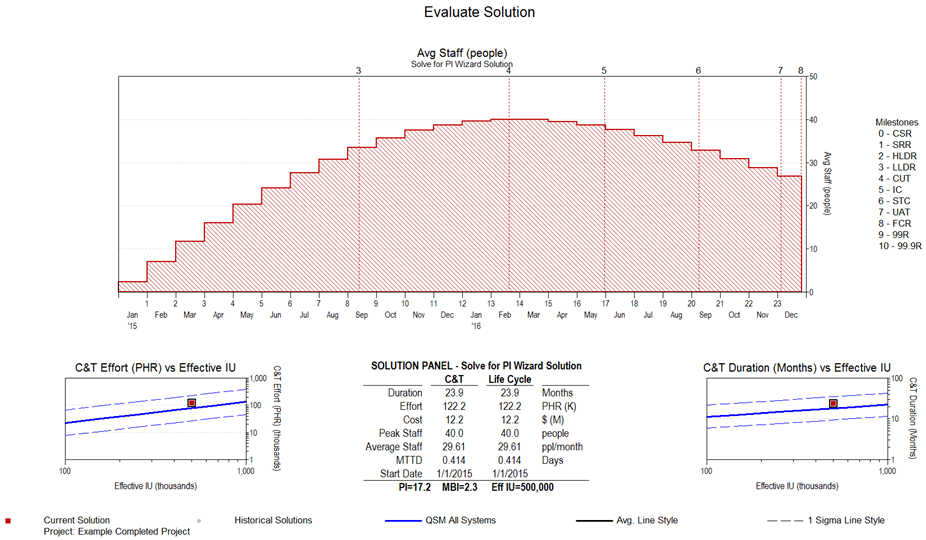
To generate the derived PI, use the solve for PI wizard in SLIM-Estimate. For example, if the historical project had a 24 month duration, 40 peak staff, and a size of 500,000 implementation units:
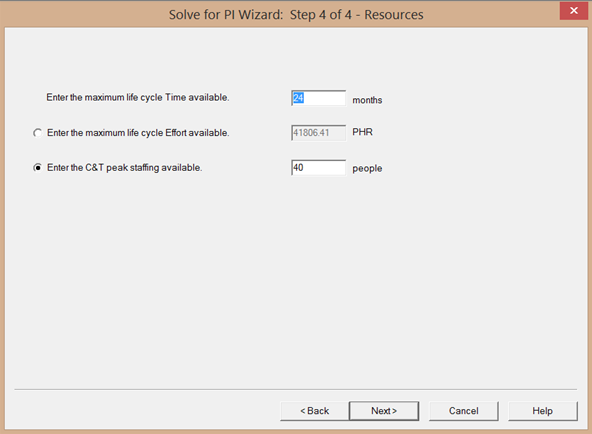
The Solve for PI Wizard derives 122k person hours and a Derived PI of 17.2 (using the default medium front load staffing curve shape). For comparison, the actual PI was 17.9.
For this statistical test, I used a sampling frame of projects in the QSM Database that had all these:
- Effective SLOC
- Main Build Duration
- Main Build Effort
- Main Build Peak Staff
- PI
I took a random sample of 93 projects from the frame. (Why 93? Statistically, I needed at least a dozen, so I kept going until I got tired! But seriously, that is more than enough to provide a valuable answer to our question1.)
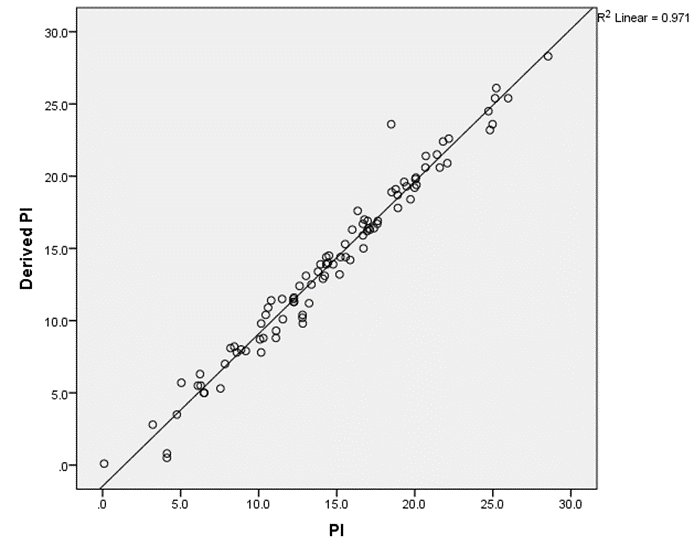
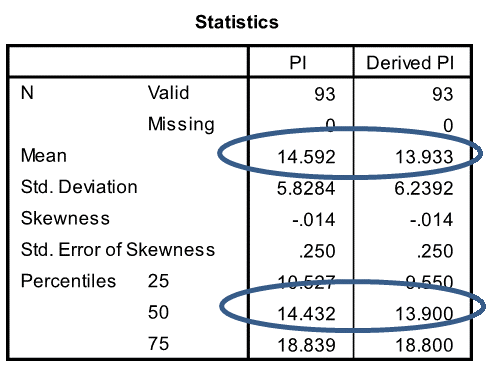
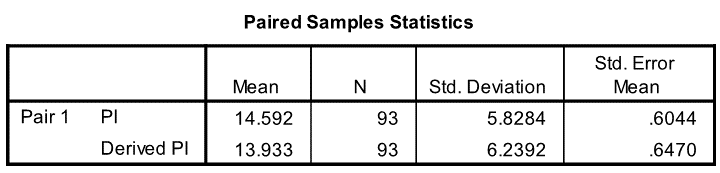
Comparing the derived PI to the actual PI for each of the sample reveals a high correlation (0.971). Which is promising, even though the means and medians are slightly different (blue ovals on table). We need to dig deeper.
First, a short digression or reminder about paired tests.
- In a paired test, samples are collected in pairs of values, such as before and after measurements, or, in this report, an actual and a derived PI for the same project.
- An independent paired samples Student’s t test compares the mean value of the differences between the paired samples.
- The null hypothesis is that the difference in means is zero.
- The test that rejects the null hypothesis indicates that we have evidence that the performances are different. We then conclude that the difference is unlikely to be due to random variation.
Got that? OK, onward to the numbers.
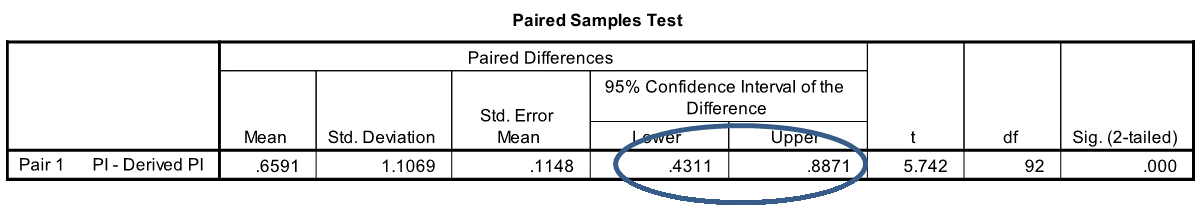
The mean actual PI of the sample was higher than the mean derived PI. Statistically, we end up with a range of between 0.4 and 0.9 (blue oval on next chart) for the difference between the mean actual PI and the mean derived PI (95% confidence interval of the difference).
Concluding that the actual PI and the derived PI are not equal, what should we do?
The high correlation between the actual and derived PI means that we CAN use peak staff to estimate PI, with a correction.
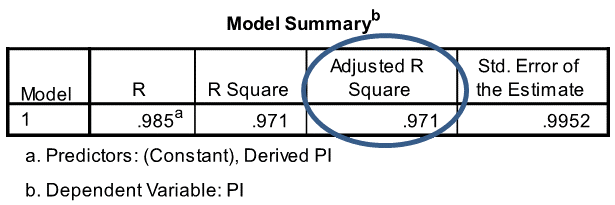
One adjustment method would use a linear regression to improve the match. The adjusted R Square of the model is a robust 0.971.
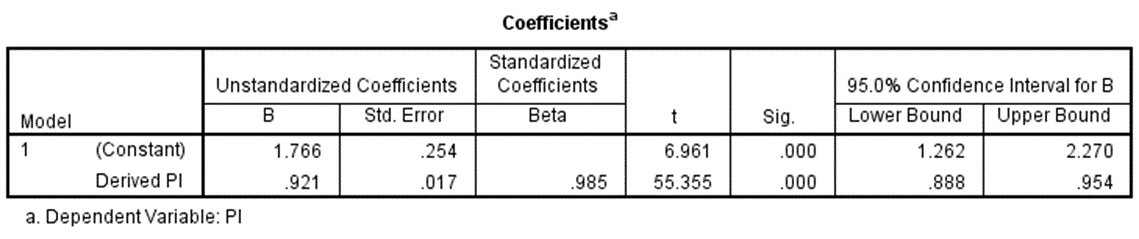
The model provides this equation:
Adjusted Derived PI = (Derived PI * .921) + 1.77
The following table contains the particulars.
If the equation is too complex, an easier adjustment would be to just increase the derived PI by the sample mean difference, which we have seen was 0.66.
In conclusion, we can derive a useful estimate of PI from peak staff where the actual effort is unknown. This will allow you to increase the number of historical projects with PI in your database even when you cannot collect actual effort.
1. Statistical Rules of Thumb, Gerald van Belle. Wiley, 2002. Pages 18-19.