Paul Below's blog

Paul Below's blog

Derived PI: Is PI from Peak Staff “Good Enough”?

Are you having a hard time collecting total effort for SLIM Phase 3 on a completed project?

Can you get a good handle on the peak staff?

Maybe we can still determine PI!

It is difficult and often time consuming to collect historical metrics on completed software projects.  However, some metrics are commonly easier to collect than others, namely, peak staff, start and end dates of Phase 3 and the size of the completed project.  Asking these questions can get things started:

  • So, how many people did you have at the peak? 
  • When did you start design and when was integration testing done?
  • Can we measure the size of the software?

That gives us the minimum set of metrics to dig up.

However, the PI (Productivity Index) formula also requires phase 3 effort.  Can we use SLIM to generate a PI that is useful, using peak staff instead of total effort?

A statistical test on historical metrics can answer this question.

What are we comparing?

  • Projects used in this study had all 4 of the following:  actual reported effort; size; peak staff; duration.
  • For each project, a derived effort is generated from peak staff, size and duration. 
  • A derived PI is generated from the derived effort, size and duration.  This derived PI is then compared to the actual PI.

Definitions for terms:

Blog Post Categories 
Productivity

The Impossible Region, Revisited

In software estimation, some discovered relationships turn out to be true primary principals of software development.

Way back in 1978, Larry Putnam, Sr. discovered that the relationship between project duration and project effort was exponential.1  His equation equated to:

Duration in months = 2.15 times the cube root of effort in manmonths

In his 1981 book, Barry Boehm described the nominal relationship in COCOMO2 as:

Duration in months = 2.5 times the cube root of effort in manmonths

Very similar results.  Is that something specific to the way projects were managed way back then?  Or, is this a true fundamental law of software project management?

Sometimes, it is fun and also informative to revisit pioneering work to see how things have (or have not!) changed over the decades since.  I have used updated benchmarking data to check this staffing relationship and found it to be surprisingly persistent. 

I took project Main Build (Design through Test) effort and Main Build duration from the QSM database, for projects that have competed in the 21st century.

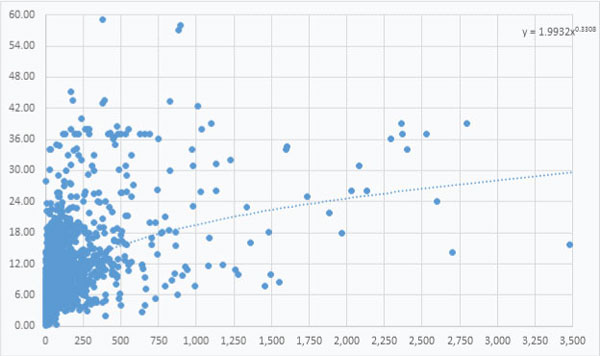
The following graph has duration in months on y axis, and effort in personmonths on x axis.

The exponential regression shows that the “nominal” duration of these projects = 2.0 x cubed root of effort.  

Software Project Impossible Regision

Blog Post Categories 
Estimation

Averages Considered Harmful

Arithmetic mean (aka average) is often a misleading number. One reason for this is that mean is sensitive to outliers. A very large or a very small value can greatly influence the average. In those situations a better measure of center is the median (the 50th percentile). But there is a second huge pitfall awaiting anyone using average for estimating or benchmarking: software size.

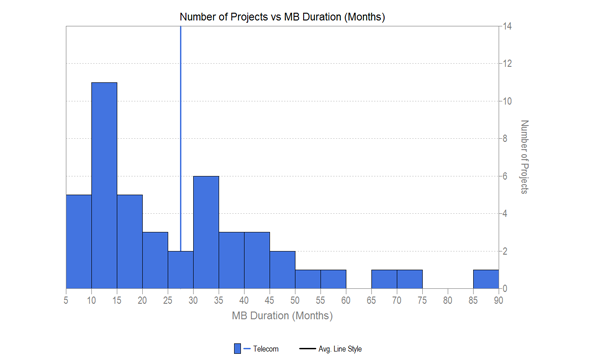
Even though we know that software size has a major influence on the key metrics (e.g., effort, duration, productivity, defects) many people insist on reporting and comparing and using the average value. Let’s look at an example. Consider a sample of 45 completed telecommunications application type projects. Picking one of the key metrics already mentioned, duration of phase 3, we can generate a histogram and calculate the mean. The average duration is 27.5 months. Does this tell us anything useful?

Number of Software Projects vs. Duration

The histogram of durations shows a skewed distribution (many projects have a shorter duration, few have a long duration), so we will need to do some sort of normalization before the average is a measure of center.  And even then, what about size?  In a typical SLIM scatterplot of duration versus size for these projects, we can see that in general larger projects take longer than smaller ones.  

Blog Post Categories 
Software Sizing

Probability, Baseball, and Project Estimation

How is baseball analysis like software project management?  One way is the ability to continually update estimates and forecasts, as the situation and our knowledge change.  As Larry Putnam Jr recently wrote, “project estimation should continue throughout the entire project lifecycle”. 

Walter Shewhart, the father of Statistical Process Control, explained it like this:

“…since we can make operationally verifiable predictions only in terms of future observations, it follows that with the acquisition of new data, not only may the magnitudes involved in any prediction change, but also our grounds for belief in it.”

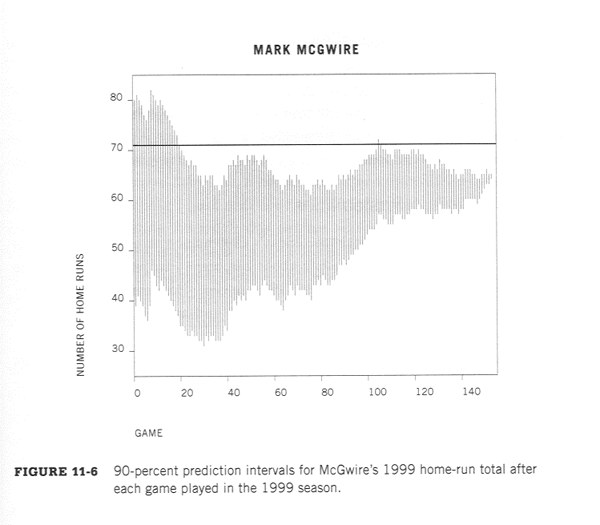
Here is a baseball example that should appear very familiar to software estimators who are familiar with the often quoted cone of uncertainty.  The following graph is taken from Curve Ball: Baseball, Statistics, and the Role of Chance in the Game, by Jim Albert and Jay Bennett.

Baseball Software Project Probability

The above model is based upon only a few simple items:  The number of homeruns hit so far; the number of games played so far and number remaining; and the total number of games in a season.  We could try to improve the model, especially early in the season, by incorporating more information.  For example:  

Blog Post Categories 
Estimation Data Project Management

Velocity: What Is It?

It’s easy to get confused or overly concerned about measuring velocity. Actually, the concept is almost embarrassingly simple. Velocity in Agile is simply the number of units of work completed in a certain interval. Like in many fields, Agile proponents appropriated existing terminology.

Here is one typical definition, from agilesoftwaredevelopment.com:

In Scrum, Velocity is how much product backlog effort a team can handle in one Sprint. Velocity is usually measured in story points or ideal days per Sprint… This way, if the team delivered software for 30 story points in the last Sprint their Velocity is 30.

Velocity as a capacity planning tool used in Agile software development is calculated from the results of several completed sprints. This velocity is then used in planning future sprints.

The concept of velocity comes from physics. In physics, velocity is speed and direction, in other words, the rate of change of position of an object. Speed can be measured in many different ways.

In software, speed is frequently measured as size per unit of time (sometimes this has been called delivery rate). The measure of size could be any of the common size measures: lines of code, function points, requirements, changes, use cases, story points. The measure of time could be calendar time (month, week, day) or it could be specific to a project (sprint, release). As to direction, in software hopefully the direction is positive, but sometimes projects go backwards (for example, backing functionality out of a system).

Blog Post Categories 
Sizing Agile

Improve Your Project Comparisons

Here is a helpful tip for comparing project performance for projects of different sizes.

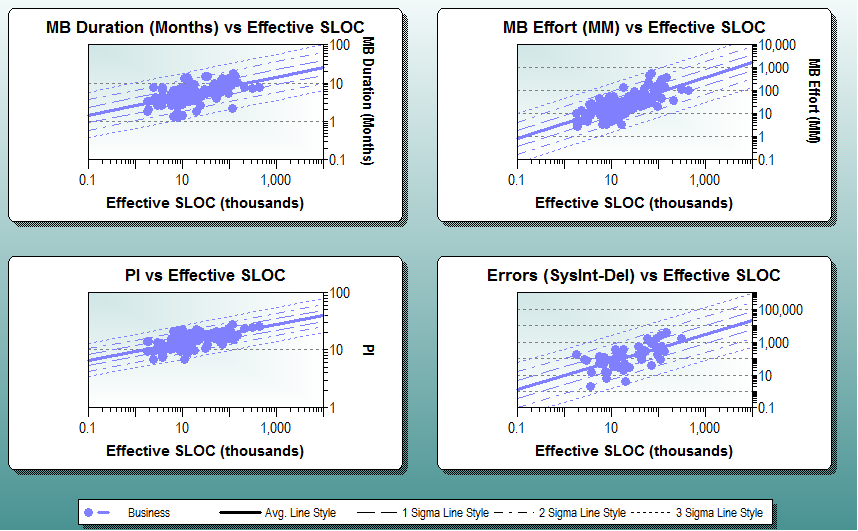
Software size has a big impact on metrics like effort, duration, defects, or productivity. We have known for many years that the relationship between project size and most software metrics is exponential. That is why our trends appear straight on a log – log scale.  SLIM Suite tools take project size into account by regressing core software metrics like effort, duration, or productivity against size to sanity-check estimates and benchmark completed projects:

SLIM standard deviation trend lines

The charts above show both the average trend and +/- 1, 2, and 3 standard deviation trend lines.  As a rule of thumb, a normal distribution (or one that has been normalized by transformation such as our log scale) will typically contain 68% of the data between +/- 1 standard deviation of the mean, 95% within +/- 2 standard deviations, and 99.7% within +/- 3 standard deviations.

Information about the standard deviation can be useful when analyzing software metrics, and it is quite easy to produce in SLIM-Metrics. Starting with a database of SLIM-DataManager projects, you can get a table of the standard deviations using SLIM-Metrics’ five star reports.

Here is a five star report for a set of Command & Control (C&C) software projects.

Blog Post Categories 
SLIM-Metrics Tips & Tricks

Q&A Highlights from "Maximizing Value Using the Relationship between Software Size, Productivity, and Reliability"

During the webinar I recently presented, "Maximizing Value Using the Relationship between Software Size, Productivity, and Reliability," I received quite a few interesting questions. Here are the highlights:

Do you see the same behaviors in Agile projects as those you presented in this webinar?

In the work for my presentation, I did not look at Agile projects separately.  I was looking at overall trends, breaking things down by application type rather than by development methodology. 

However, Don Beckett recently made a conference presentation on Agile called “Beyond the Hype”.  Don looked at duration, effort, staff, productivity for Agile projects.  There is a nice table where he compared the performance of a typical agile project to a typical IT project. 

Don’s presentation summarizes it well.  The staff is a little higher on Agile projects, the duration and effort are a little lower, but the basic relationships between the metrics and size are similar.

Does the language an application development project is written in have any impact on the data? In other words, when looked at independently, do mainframe COBOL projects look different than .Net projects? 

Blog Post Categories 
Webinars

Software Mythbusters: The Single Version of the Truth

Recently I attended a seminar on a commercial reporting and data sharing product. In the sales material and discussion, the phrase “Single Version of the Truth” was used several times. But what does it mean?

“In computerized business management, svot, or Single Version of the Truth, is a technical concept describing the data warehousing ideal of having either a single centralised database, or at least a distributed synchronised database, which stores all of an organisation's data in a consistent and non‐redundant form.” - Wikipedia

The concept is attractive to decision makers who collect and analyze information from multiple departments or teams. Here's why:

“Since the dawn of MIS (Management Information Systems), the most important objective has been to create a single version of the truth. That is, a single set of reports and definitions for all business terms, to make sure every manager has the same understanding.”

Sounds simple, doesn’t it? Sales pitches for svot imply that if distributed data sources were linked into a single master repository, the problem of unambiguous, consistent reporting and analysis would be solved. Yet reports are often based on different data using different definitions, different collection processes, and different reporting criteria.

Blog Post Categories 
Benchmarking Software Mythbusters

Part IV: Duration, Team Size, and Productivity

For many projects, duration is just as important a constraint as cost. In this installment we will tackle the question:  How do changes to team size affect project duration and the resulting productivity?  Once again we will use our database of business applications completed since January, 2000.

Continue reading...

Blog Post Categories 
Team Size Productivity

Calculating Mean Time to Defect

MTTD is Mean Time to Defect.  Basically, it means the average time between defects (mean is the statistical term for average).  A related term is MTTF, or Mean Time to Failure.  It is usually meant as the average time between encountering a defect serious enough to cause the system to fail.

Is MTTD hard to compute?  Does it require difficult metrics collection? Some people I have spoken to think so.  Some texts think so, too.  For example:

Gathering data about time between failures is very expensive.  It requires recording the occurrence time of each software failure.  It is sometimes quite difficult to record the time for all the failures observed during testing or operation.  To be useful, time between failures data also requires a high degree of accuracy.  This is perhaps the reason the MTTF metric is not widely used by commercial developers.


But this is not really true.  The MTTD or MTTF can be computed from basic defect metrics.   All you need is:

  • the total number of defects or failures and
  • the total number of months, weeks, days, or hours during which the system was running or being tested and metrics were recorded.  You do not need the exact time of each defect.

Here is an example.  I will compute MTTD and MTTF two ways to demonstrate that the results are identical.  This table contains defect metrics for first three days of operation of a system that runs 24 hours a day, five days a week:

Blog Post Categories 
Defects