Here is a helpful tip for comparing project performance for projects of different sizes.
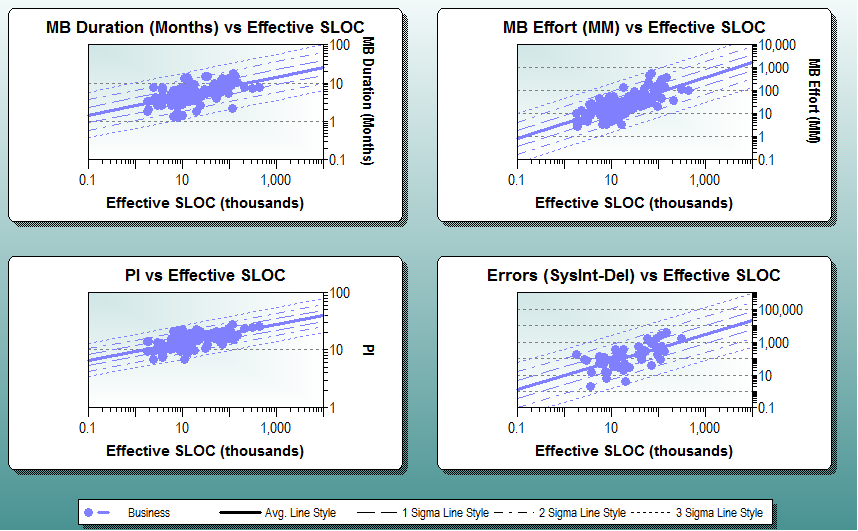
Software size has a big impact on metrics like effort, duration, defects, or productivity. We have known for many years that the relationship between project size and most software metrics is exponential. That is why our trends appear straight on a log – log scale. SLIM Suite tools take project size into account by regressing core software metrics like effort, duration, or productivity against size to sanity-check estimates and benchmark completed projects:

The charts above show both the average trend and +/- 1, 2, and 3 standard deviation trend lines. As a rule of thumb, a normal distribution (or one that has been normalized by transformation such as our log scale) will typically contain 68% of the data between +/- 1 standard deviation of the mean, 95% within +/- 2 standard deviations, and 99.7% within +/- 3 standard deviations.
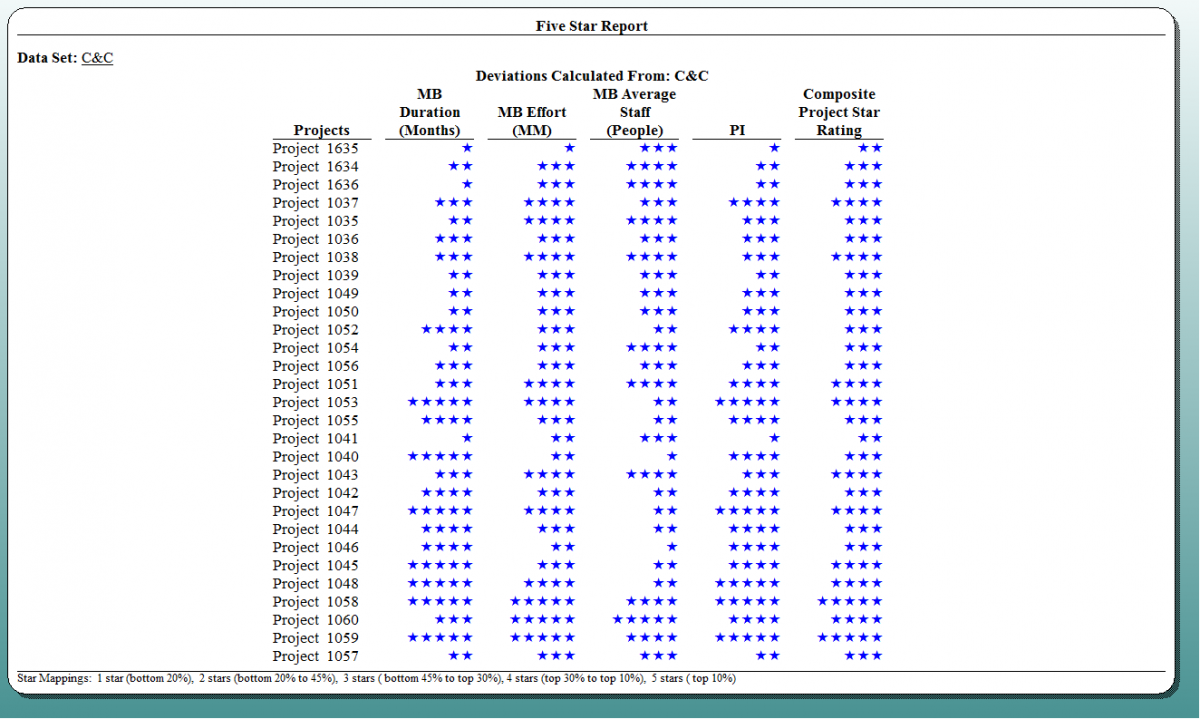
Information about the standard deviation can be useful when analyzing software metrics, and it is quite easy to produce in SLIM-Metrics. Starting with a database of SLIM-DataManager projects, you can get a table of the standard deviations using SLIM-Metrics’ five star reports.
Here is a five star report for a set of Command & Control (C&C) software projects.

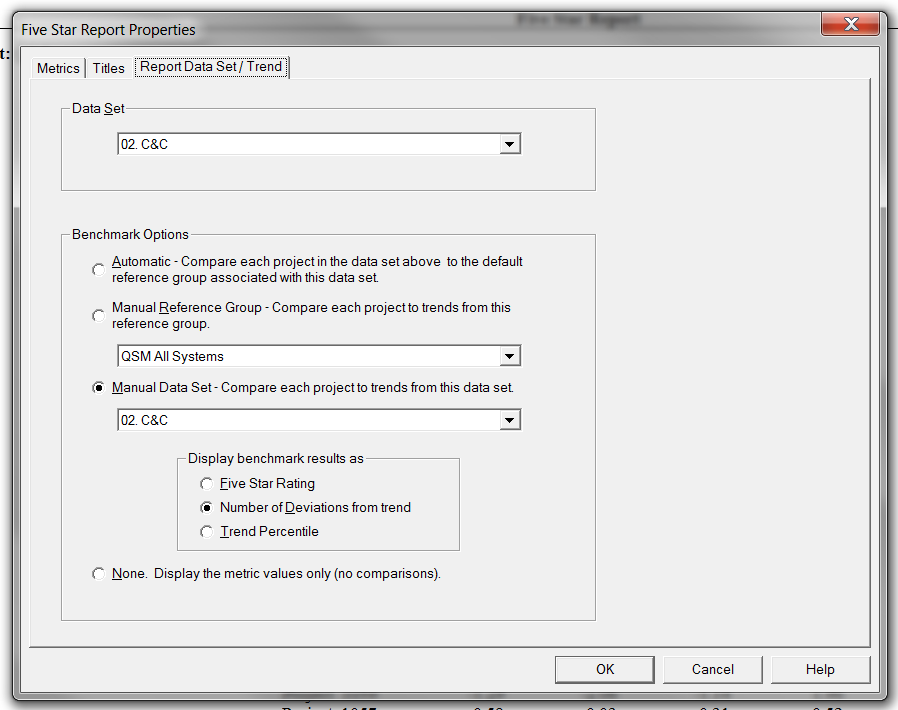
To create this report, insert or edit an existing five star report. Right click on the report and the properties window pops up. From the Report Data Set / Trend tab, you can pick a data set, set your benchmark option (manually select the reference group you want or have SLIM-Metrics calculate a trend line from your data set), then use the radio buttons to display the desired standard deviation lines:

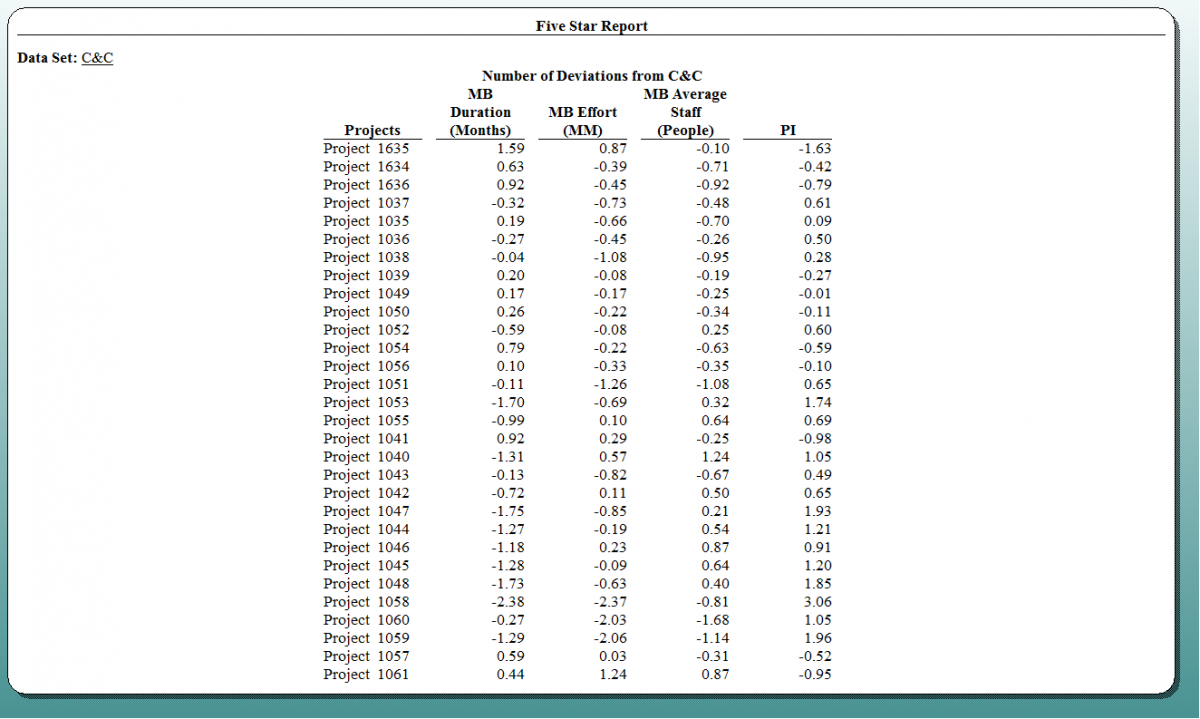
The output is a table of projects with standard deviation values for each of the variables in your five star report (Duration, Effort, Average Staff and PI in this example). The numbers in the table represent the project’s position against the benchmark trend (number of standard deviations above or below the trend line). The table can be exported to Excel if you want to use the numbers in other analysis (such as “best project, worst project” type comparisons).
Remember that for some metrics (effort or duration), negative numbers represent better outcomes (less effort/time) than positive numbers. For example, it is better for a project to have effort one standard deviation under the trend line than one standard deviation above it.

These numbers could also be called normalized residuals (in other words, for each project, the number of standard deviations the project is from a specific trend line). They normalize for both size (if your x axis is size) and the exponential relationship between your regression metrics. Using normalized metrics helps to ensure valid comparisons and improves benchmarking and performance analysis.
Want to learn more about SLIM-Metrics and our benchmarking consulting services? Get a customized demo from one of our representatives today!
