In today's world, Data Analytics is everywhere helping us recognize patterns and trends, providing insights, and driving business decisions. Software engineers, cost analysts, and project and portfolio managers need data to:
- Sanity check vendor bids
- Prioritize software projects with the highest ROI or to achieve strategic goals
- Secure resources for projects in their pipeline
- Calculate and benchmark productivity and capacity
- Create realistic estimates and plans for new projects.
So ensuring your data is valid and relevant is crucial.
Episode 2: Why Quantify Software Size? is part of our video series, Software Size Matters! Why Quantifying Software Size is Critical for Project Estimating, Tracking, and Performance Benchmarking, that explores how you not only can but should be using software size measures at every stage of the software project, program, or portfolio management process. In this episode, we'll talk about how to keep your measurement process simple and useful and show key software project performance insights gained from software size.
Watch Episode 2: Why Quantify Software Size?
In Episode 1 we said that not only do software project time, effort, quality and productivity increase with software size, but that they increase in a nonlinear fashion.
Understanding these relationships helps us accurately predict software development, project costs, duration, and defects.
Software Performance Measurement Tips
Gathering and analyzing software project data isn't cost free, so we need to make sure that measurement is:
- Practical − measurement is possible with a reasonable amount of effort.
- Useful − supports the organizational priorities and critical decisions.
- Easy to capture − the metric set is small and manageable.
- Comparable − standard definitions for each metric promote apples to apples comparisons.
For example, which team roles are included in the effort, planned or actual? Which activities are included in the planned or elapsed schedule or time to market?
Five Core Metrics for Software Projects
Sticking to just five core metrics makes measurement efficient. Think of them as 5 dimensions of a software project:
- Size − the value created; requirements, features, stories, etc. They're the proxy for the work required to translate requirements into functional software.
- Effort − person hours, which determines the cost and staff needed to finish on time.
- Time − the duration to complete the work, typically in months.
- Productivity − the demonstrated efficiency and ability to deliver X amount of features within Y amount of time using X staff.
- Defects − knowing if software quality is good enough to release, which is a function of defects remaining and SLIM's reliability measure, the Mean Time To Defect.
Focus on high level metrics shared by all software projects. Larry Putnam, senior the founder of Qsm, was so passionate about it, he wrote a book, Five Core Metrics: The Intelligence Behind Successfil Software Management. Check it out.
Software Development Productivity, Defect Density, and More
Do we really need to collect all this data? Most software organizations collect only a subset of the five core performance metrics. But without size, these metrics can't be meaningfully compared. Is time to market five months good or bad? How big a team do we need to deliver on schedule? Both depend on how much work is required to design, build, test, and deliver.
If your organization only records cost, staffing, effort, time, and maybe defects, how will you meaningfully compare performance or calculate capacity? Consider two projects:
|
PROJECT A |
PROJECT B |
|
Time: 6 months |
Time: 6 months |
|
Effort: 10,000 hours |
Effort: 10,000 hours |
|
Defects: 500 |
Defects: 500 |
On the surface, these two projects look the same. What can we reasonably deduce about them? Not much, because we have no way of quantifying the value delivered or the work required to create that value. It might be better to have one project take longer and use less effort, or use more effort to reduce the time, but likely produce more defects. Remember software project staffing and effort alone don't tell us how much work was accomplished, only how much, only how many staff per hour were assigned or charged to the project.
If we add software size, some quantity of features or value constructed and delivered, we can calculate productivity and defect density, an important quality indicator.
|
PROJECT A |
PROJECT B |
|
Time: 6 months |
Time: 6 months |
|
Effort: 10,000 hours |
Effort: 10,000 hours |
|
Defects: 500 |
Defects: 500 |
|
* 50 Features |
* 300 Features |
* Assume “features” are roughly equivalent in “size” (same # of low-level programming/configuration steps required to implement an average feature)
For productivity and throughput, a ratio based productivity using either time or effort per feature, we get 8.3 versus 50 features per month and 200 versus 33 hours per feature. For defect density, we get 10 versus 1.7 defects per feature. QSM's productivity measure, the Productivity Index (13.9 for Project A vs 19.5 for Project B), measures the overall project efficiency and includes time in the calculation. The fact that it is a unitless number means it is comparable across many project and application types and organizations. Click here to learn more. An important point is that literally every productivity measure uses resources, required time, effort, or cost per product unit. Ignoring how much product you plan to build makes it literally impossible to calculate productivity.
Once we add size to the major management metrics, predictable and robust patterns emerge as size increases on the X axis left to right, the average value of each major management metric goes up. But these relationships aren't linear. That means that simple rules of thumb can't be used to model complex behavior. Variation of each size is greater for metrics like effort and defects, which are often influenced more by management strategy or time pressure than metrics like schedule.
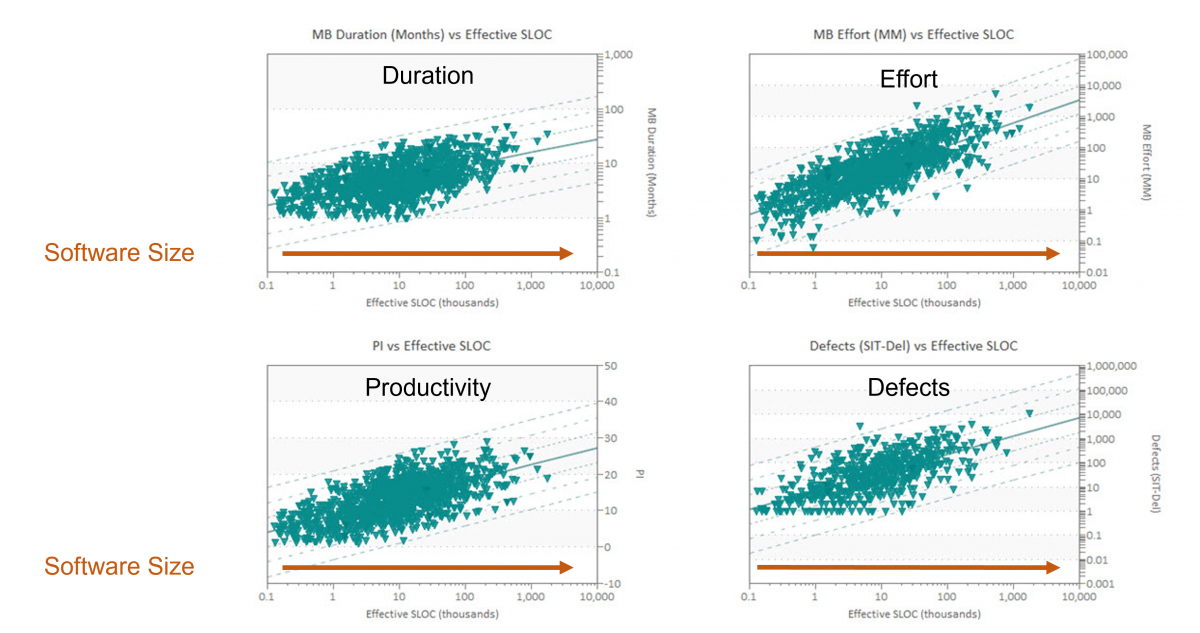
Knowing the average values for schedule, effort, defects, and productivity at various project sizes helps organizations:
- Evaluate the realism of vendor bids
- Estimate and plan new projects0
- Identify unrealistic productivity assumptions
- Compare project plans against industry data or their own demonstrated performance.
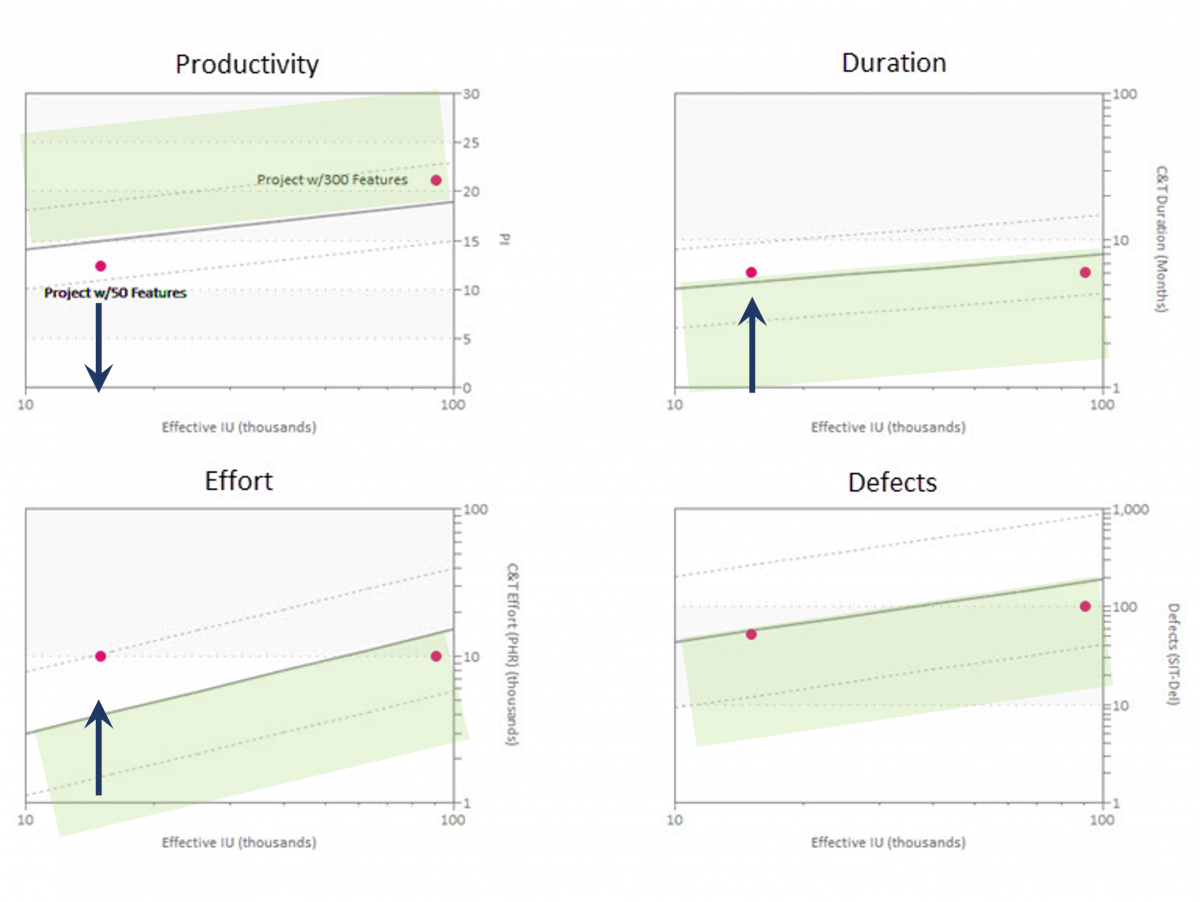
To see how size supports, estimate, validation and post-delivery benchmarking, let's compare our two sample projects. Taking project size into account enables meaningful project comparisons and provides context. The shaded region indicates more efficiency. Comparing our two software development projects against industry trend data, we can see that 50 feature project used more effort and took more time than average than industry averages for a project of the same size. Because both time and effort were above the industry average, productivity was lower than average.
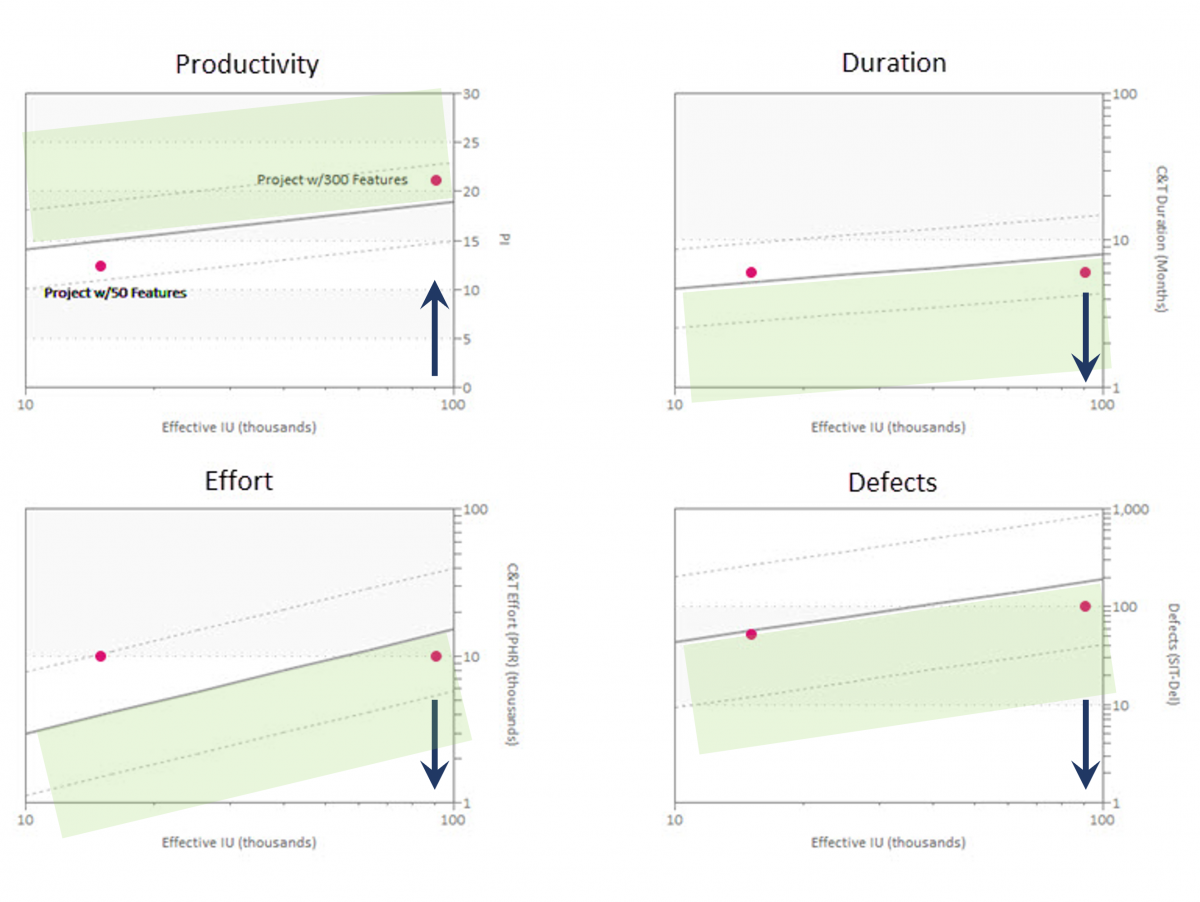
Now let's look at the 300 feature project. The 300 feature software development project used less effort and delivered in less time than the industry average for a project of the same size. Result. Productivity was higher than average and defects were lower.
Takeaways:
- Getting software size data can be challenging, but the insights gained are more than worth the time and effort.
- Focusing on five core metrics keeps measurement efficient and practical. Software size matters because duration, effort, productivity and defects all increase with size. Your analytics are faulty without it.
- Size measures are needed for performance comparisons against industry data and your own projects. They provide context. The value what you plan to deliver, and later, what you actually deliver for the time and money spent. Knowing your actual productivity is crucial for calculating reasonable estimates