Executive teams and your end clients always want to know, “how good are our development teams?” Agile development teams usually promise that they can deliver faster and cheaper with better quality. But how do you truly know this is the case? The only way to really know is to apply quantitative measurement to agile. With the SLIM solution you can look at a completed agile project and determine the productivity that was demonstrated. This productivity metric encompasses all environmental factors, such as how good is the skill level and experience of your development team? How good are the tools and methodology in place? What is the technical complexity of the software you are building?
So now let's calculate your team's productivity. SLIM leverages the Putnam Equation, which is: Size (Scope) = Effort1/3 x Time4/3 x Productivity. By determining the size, effort, and duration, you can solve for productivity. To determine size and scope, you can translate the post-it notes and white board information your agile teams already created. Duration is fixed with the number of sprints, while the effort expended is easily determined with fixed teams. Each project release will have its own Productivity Index or PI that you can store in SLIM-DataManager to collect and build your company historical database. As your repository grows, you will get a better understanding of your organizational capabilities. The beauty of the SLIM solution is that it leverages an industry database of over 13,000 completed historical projects! Not only can you compare organizational project release to project release, but now you can benchmark yourself against your industry peers to see how you compare to more traditional waterfall projects and other agile projects. The SLIM tool includes various industry trendlines for agile, web, package implementation, telecom, government IT systems, waterfall, etc. that can be used for comparison.
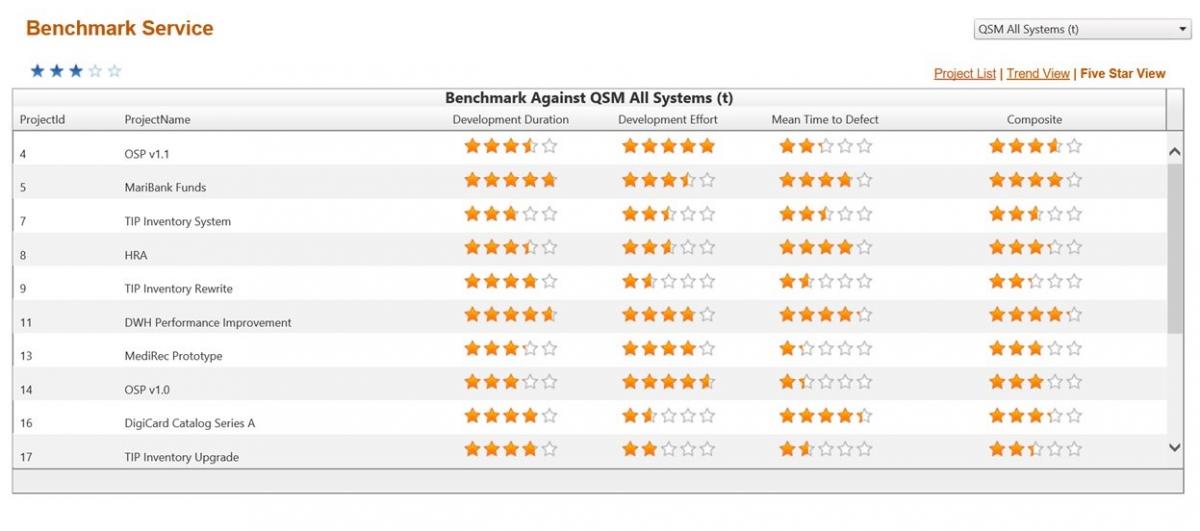
A great feature for comparing project performance is the Five Star Report in the SLIM-Suite. In SLIM-Collaborate, you are able to rate each project or release in the data set, on a scale of 1-5 stars, according to the metrics identified by the user. This gives your leadership team a report for presenting performance in the various metrics your organization cares about. The initial metrics to focus on would be size and scope, duration, reliability, effort, and productivity. Then you have an overall project rating compared to an internal or industry trend group. A 1 Star represents the bottom 20% comparative positioning; 2 Stars represents bottom 20% to bottom 45%; 3 Stars bottom 45% to top 30%; 4 Stars is top 30% to top 10 %; and 5 Stars represents top 10%. SLIM will automatically calculate a project’s productivity once you have entered the size, duration, and effort. Now this data will give you a quantitative view of your current organizational portfolio environment and give you a better understanding of your capabilities.
QSM’s SLIM solution allows you to defend your claims of cheaper and faster delivery by leveraging project release information you already have available. With SLIM you have the ability to show year over year historical productivity performance - very powerful! Why not use quantitative information to demonstrate to leadership and your clients your superior organizational capabilities? Let the data speak for itself.