At QSM, we have been on the leading edge of software estimation technology for 40 years. One of our recent innovations is to incorporate machine learning into our SLIM-Suite of estimation and measurement tools. If you are not familiar, the whole concept of machine learning is to “train” your algorithms with data to improve the accuracy of their predictions. Simple in concept, but the devil is in the details. In software project estimation, we are always asked to provide timely decision-making predictions based on skimpy information. Depending on the situation, our analysis will typically focus on one or several of the following criteria:
- Schedule (Time to market)
- Effort (Cost to develop)
- Staffing and Resources Required
- Required Reliability at Delivery
- Minimum-Maximum Capability or Functionality Tradeoffs
We start the training process by utilizing data from completed projects using these five core metrics. The data usually resides in tools like Jira or PPM products. Once obtained, we run statistical analysis on the data to determine typical behaviors and variability.
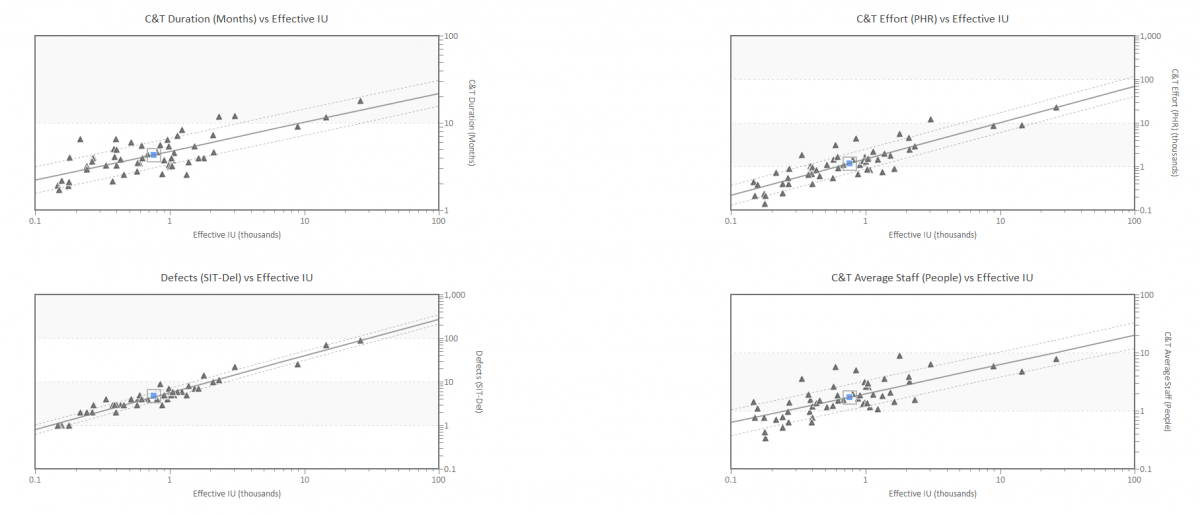
Figure 1. Project data used in SLIM Machine Learning Training Process. Triangles represent completed projects. Lines are curve fits of the average behavior and statistical variation in the positive and negative directions. These charts show how time, effort and staffing change depending on the size of the product to be developed.
We usually need a minimum of 6 to 8 projects to get started, but would prefer 15 to 20 projects to give a more robust sample. Ideally, we train the algorithms based on a very specific platform, application domain, and development method. For most organizations, we might have 3-5 training data sets which could include Agile Method, Waterfall Method, Package Implementation Products, Cloud Migration Projects, and Maintenance Projects.
One of the real challenges in doing an estimate is determining how much functionality will need to be built to implement the required capabilities. By using the statistics of the training data, we build a t-shirt sizing method. From your history, we will learn what very small and very large are, so you can simply use the slider tool to get a size estimate from the t-shirt categories.
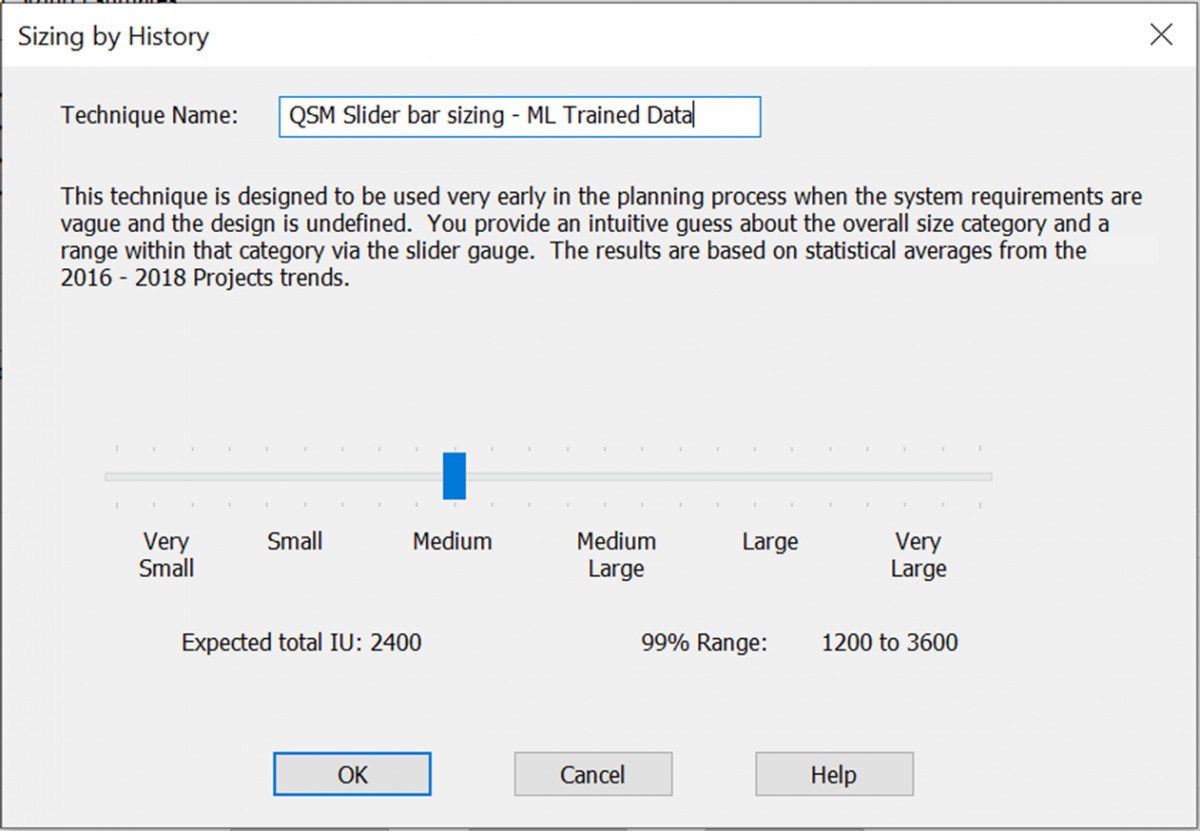
Figure 2. Training our T-Shirt sizing method from the historic training data.
Once the data training is complete, we build a tailored configuration for each project type, which are then available to support estimation in that application area. Figure 2 shows an estimate in a maintenance environment. The graphs show the staffing profile required to make the change being requested. This is a typical solution for a medium project in this domain. The blue squares superimposed on the historical data show that this estimate is clearly in the middle of the history, building confidence in the estimate. Using this as a starting point, you might want to increase staff to reduce the schedule. This can be done interactively, and you can always see where the new estimate falls relative to the historical data. As long as your alternative scenarios fit within the history profile, you are probably ok, but if it gets to the outer edges then you are starting to tread on thin ice.
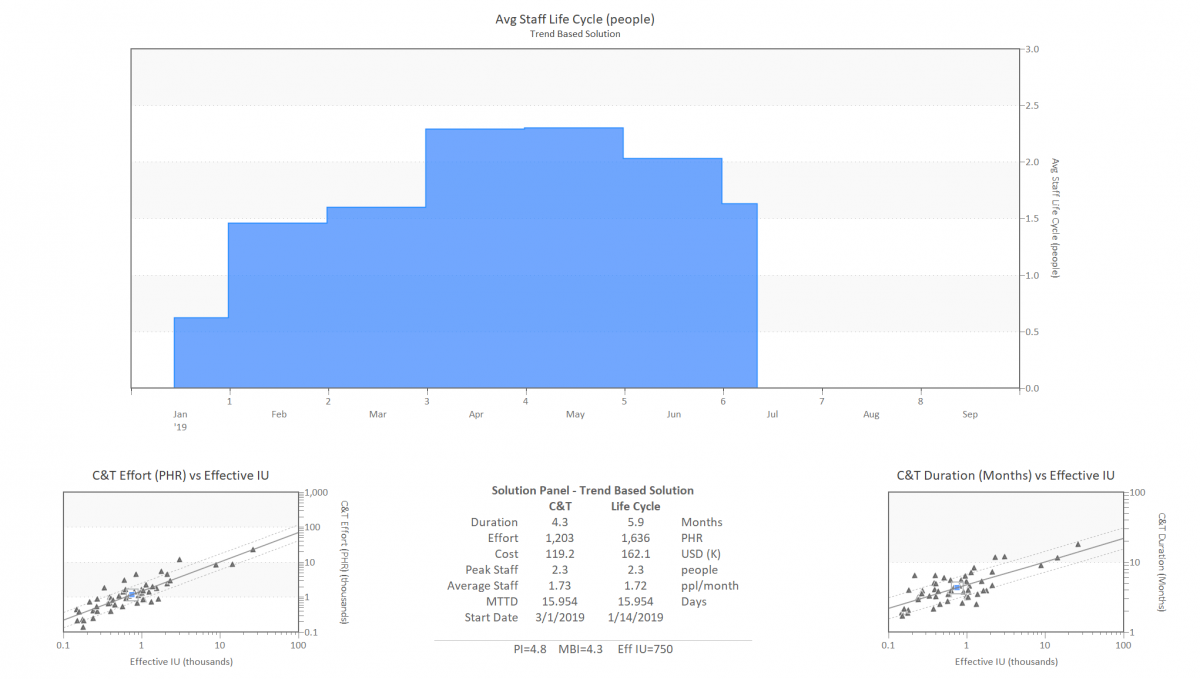
Figure 3. Estimation scenario using the trained and configured solution for maintenance environments.
This method is equally effective if you are trying to educate customers about having realistic expectations or validating contractor bids. Big data or small, any data helps. Try the machine learning capabilities in SLIM and watch your project estimates get dialed into reality.