Metrics

Metrics

Top 5 Resources for Increasing Software Development Predictability in 2020

Top 5 Software Estimation Resources in 2019
As we enter a new decade, it's important to take a look back at where we've been. The past 10 years saw the introduction of the Ipad, Microsoft Azure, Uber, 4G networks, and Instagram. Some might look back and call this the era of cloud computing and artificial intelligence with increased connectivity and efficiency in technology like never before. But software development goals have remained largely the same: to reduce cost and time to market, increase quality and maintainability, and allocate resources more efficiently. I'm willing to bet those goals will not change in the coming decade. At QSM, we have always believed that the only way to combat the unknown is with practical measurement and metrics grounded in data from our past. As we look to 2020, let's take a look at our top 5 resources from 2019, featuring the most current insights from our industry experts on the state of software estimation and project management and development trends. 

What better way to get a bird's eye view of software development's history than with a look at long-term trends? Leveraging QSM's industry database of over 13,000+ completed projects, Katie Costantini's "Long Term Trends from 40 Years of Completed Software Project Data" took a high-level look at changes to software schedules, effort/cost, productivity, size, and reliability metrics from 1980 to 2019. The study compared insights to similar studies QSM has completed at regular intervals over the past four decades and answered questions like, 'what is the "typical" project over time?' and 'why are projects "shrinking?"

Blog Post Categories 
Metrics Estimation QSM Database

QSM Database Now Includes More Than 13,000 Completed Projects

QSM is pleased to announce a major update to the QSM Database, the largest continuously-updated software project performance metrics database in the world. With this update, we have validated and added more than 2,500 projects to the database in 9 major application domains (Avionics, IT, Command & Control, Microcode, Process Control, Real Time, Scientific, System Software, and Telecom) and 45 sub-domains, resulting in a current total of more than 13,000 completed projects.

With this update, the number of agile projects in the database increased by 340%, resulting in some changes to the agile trend line. Specifically:

Blog Post Categories 
QSM Database Metrics SLIM Suite

New Article: Function Point Sampling Holds Promise for Software Metrics

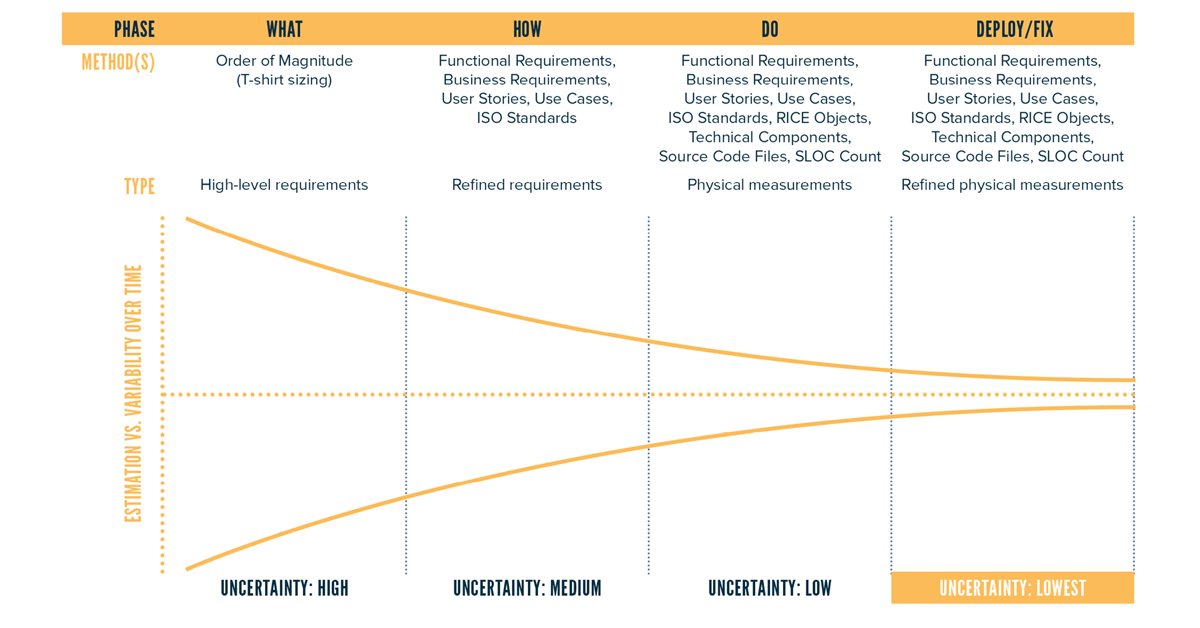
Cone of Uncertainty

As we embark on 2017, which is also the 30th anniversary of IFPUG Bylaws, there are reports that the software development industry is making progress. The 2015 Standish Group CHAOS report cited that agile projects are, on average, three times more likely to be successful than waterfall projects (based on their survey of over 10,000 projects.) The not-so-good news, however, is that the percent of successful projects (defined as on-time, on-budget, and with a satisfactory result) hasn’t changed much since the first CHAOS report in 1996, and hovers around 40%. The top three success factors in the 2015 report were not technical: 1. Executive Support, 2. Emotional Maturity and 3. User Involvement (agile processes ranked #7.) The need for software sizing measures to support project estimating remains just as critical as it was 30 years ago, yet IFPUG function points are not used as extensively as they could be to support software sizing. Rather than “throwing the baby out with the bathwater,” so to speak, or creating new metrics to solve old problems, Carol Dekkers and Joe Madden suggest a new way to repurpose function points to achieve estimating successes today. This article was originally published in IFPUG's Metric Views.

Read the full article!

Blog Post Categories 
Function Points Articles Metrics

Historical Data Isn’t Playing "Hard to Get"

Historical Data Collection

“No, we don’t have any historical project data collected” is the statement I hear with some frequency when speaking to organizations about their IT project estimating processes.  Ideally we use client history to calibrate and tune the project estimates we provide.  In my quest to spread the word about parametric estimating I often encounter this notion that organizations don’t believe they have historical data in a retrievable form.  In almost every case that I have been involved, it turned out that the historical data was present, just not in the form of a 1,000 rowed spreadsheet.  Often times the data is more available than the client is aware.

Our approach works at a macro level so we are seeking overall project metrics of cost, schedule, size, staffing and defects.  If the actual formal documentation of history is not available for these five core metrics, then it usually is available by leveraging various sources within the organization.  We have found it’s common to resurrect a project’s outcome by seeking feedback from the team that worked the project, however if that’s not possible due to attrition, re-org or other disrupting factors, we can usually find the project metrics through other means.  Those other means may be time and defect tracking tools, requirements analysis tools and accounting systems.  The data is almost always documented somewhere.   

Blog Post Categories 
Database Data Metrics

New Article: Using Software Project Metrics

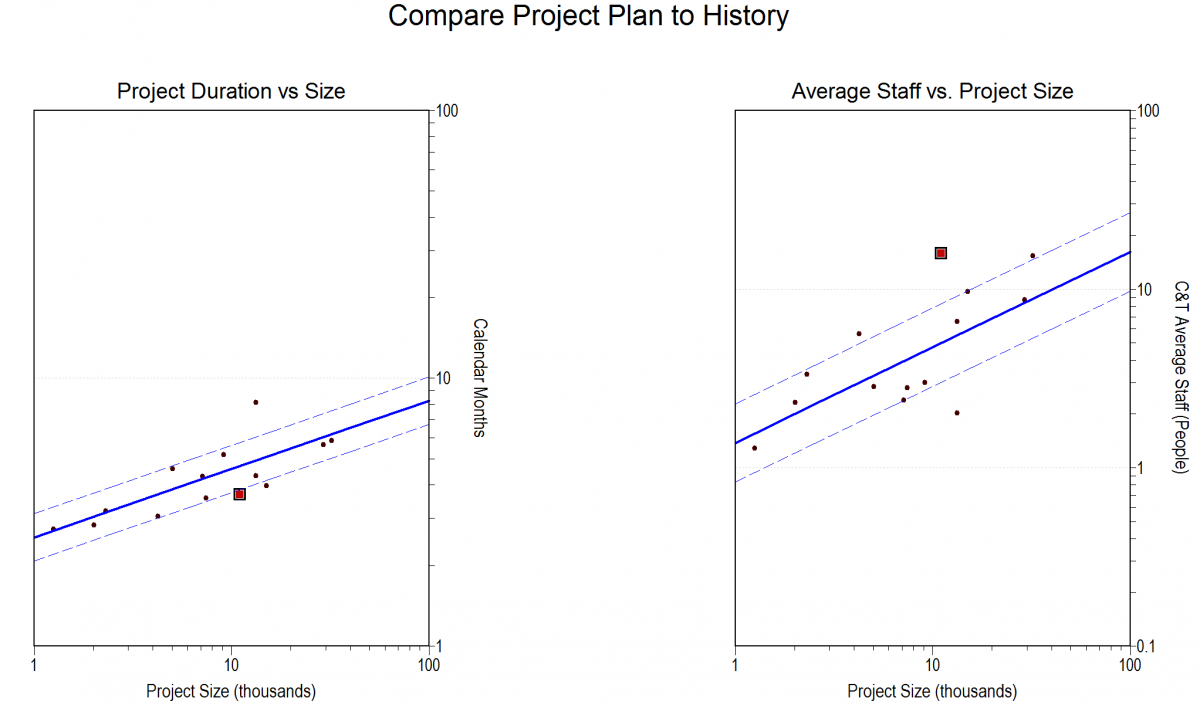
Compare Project Plan to History

Software measurement by itself does not resolve budget, schedule or staffing issues for projects or portfolios, but it does provide a basis upon which informed decisions can be made. Here are examples of how to use metrics to determine present capabilities, assess whether plans are feasible, and explore trade-offs if they are not. This is the third article of a three part series by QSM's Don Beckett for Projects at Work. You can read the first article here and the second here.

Read the article!

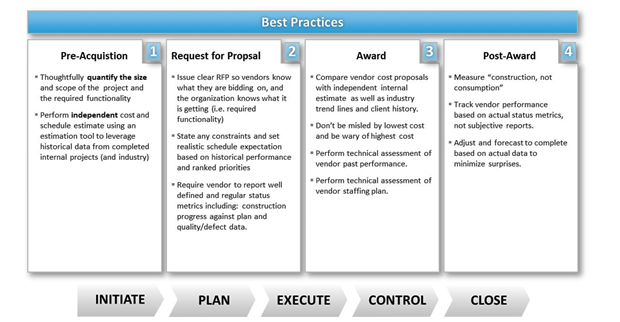
New Article - 5 Core Metrics to Reduce Outsourced Software Project Failure

Software Estimation Best Practices

Outsourcing was supposed to make government IT executives’ lives easier. Yet in too many cases, it’s had the opposite effect, leading to cost overruns, inefficiencies, and solutions that do not work. Remember the initial rollout of Healthcare.gov? Exactly.

It doesn’t have to be this way.  Believe it or not, there’s a proven solution that has stood the test of time.  In 1977, Lawrence Putnam Sr. discovered the “physics” of how engineers build software by successfully modeling the nonlinear relationship between the five core metrics of software: product size, process productivity, schedule duration, effort and reliability. 

In this article for GCN, QSM's Joe Madden explains how the five core metrics of software estimation make a powerful tool that can be used at each phase of the software acquisition life cycle to help government IT program managers make more objective, quantitative decisions.

Read the full article!

Blog Post Categories 
Articles Metrics Project Management

The Lowly Line of Code (Part One)

“I'm sorry, Dave. I'm afraid I can't do that” – HAL 9000[1]

Source lines of code (SLOC) is a measure of software size, in use since the 1960s. This blog post describes various uses of SLOC from the perspective of software measurement.

There seems to be a love/hate relationship with the line of code measure. Despite its broad and continuous use (or perhaps because of it) SLOC seems to get the blame for many a failed software project, process improvement or software metrics initiative. There are even those who claim that “…in many situations usage of LOC metrics can be viewed as professional malpractice…”[2] But, as you will see, SLOC has many benefits, when used intelligently.

Blog Post Categories 
Metrics Sizing Software Sizing

New Article - 10 Steps to Better Metrics

10 Steps to Better Metrics

An effective software measurement program is a long-term investment, not a quick fix. In this article originally published in Projects at Work, Carol Dekkers identifies 10 steps to ensure your organization's metrics deliver a positive return on that investment, from more accurate cost and schedule estimation, to streamlined processes and better insights into current and future commitments.

Read the full article!

Blog Post Categories 
Metrics Articles

A Software Metrics Snow Job

I like to ski.  I mean really like to ski.  I've done it for a long time and I fancy I'm quite good at it.  I Iike to have the latest gear too.  So I have this Ski Tracks app on my iPhone see.  It's very cool.  When I start skiing for the day I set it going and it records every run I make: the altitude, the speed.  Heck, it even tracks your runs on a map that you can export and relive on Google Earth.  Really. 

Ski Tracks also summarizes your days' efforts showing the total number of runs, the total vertical skied, the maximum altitude, the time spent skiing, the distance traveled, the angle of the slope…

A Hard Day on the Slopes

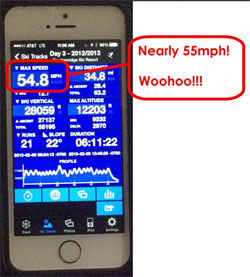
Software Metrics Snow JobSitting in the condo at the end of a hard day on the slopes of Breckenridge Resort in Colorado, I checked my Ski Tracks for the day.  "Woohoo!" I said.  "Glenn, come check this out!"  My ski buddy Glenn ambled in from the kitchen; we've skied together for several years, ever since our respective spouses decided that for some reason they didn't want to ski with us anymore. 

"Look at this," I exclaimed holding up my iPhone showing the summary of my day's skiing.  "Just check out this top speed!!"

Glenn squinted at the screen.  "Hmmm, 54.8 mph," he observed.

"How about that?" I asked rhetorically, "have the ol' legs still got it or what?"  I was inordinately pleased with myself.  I mean, 54.8 mph is FAST.

Blog Post Categories 
Metrics Benchmarking

Ask Carol: Collecting Metrics Willy-Nilly Doesn't Make Sense

QSM hosts a free advice column for software professionals who seek help to solve project management, communication and general software project issues. Carol Dekkers is a QSM consultant and IT measurement and project management expert who speaks internationally on topics related to software development. Send your questions to Ask Carol!

Dear Carol: 

My manager frequently says “You can’t manage what you can’t measure” and then tells us to collect more and more metrics, willy-nilly. We’ve done this for years now and it just doesn’t seem to make sense to collect all this data that’s never used, when we’ve got better things to do like developing software. What can we do to make him stop this unproductive exercise?

– Over Metricated

Dear Over: 

 This is a common situation in software development: management pursuit of metrics without a clear plan to use them.

The “you can’t manage what you can’t measure” is a paraphrase of Tom DeMarco’s quote, “You can't manage what you can't control, and you can't control what you don't measure.”1 What is interesting is that DeMarco’s follow-up quote 13 years later is seldom cited: “Metrics cost a ton of money. It costs a lot to collect them badly and a lot more to collect them well... At its best... metrics can inform and guide developers, and help organizations to improve.  At its worst, it can do actual harm… And there is an entire range between the two extremes...”2 

Blog Post Categories 
Metrics