I like to ski. I mean really like to ski. I've done it for a long time and I fancy I'm quite good at it. I Iike to have the latest gear too. So I have this Ski Tracks app on my iPhone see. It's very cool. When I start skiing for the day I set it going and it records every run I make: the altitude, the speed. Heck, it even tracks your runs on a map that you can export and relive on Google Earth. Really.
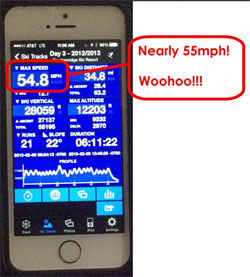
Ski Tracks also summarizes your days' efforts showing the total number of runs, the total vertical skied, the maximum altitude, the time spent skiing, the distance traveled, the angle of the slope…
A Hard Day on the Slopes
 Sitting in the condo at the end of a hard day on the slopes of Breckenridge Resort in Colorado, I checked my Ski Tracks for the day. "Woohoo!" I said. "Glenn, come check this out!" My ski buddy Glenn ambled in from the kitchen; we've skied together for several years, ever since our respective spouses decided that for some reason they didn't want to ski with us anymore.
"Look at this," I exclaimed holding up my iPhone showing the summary of my day's skiing. "Just check out this top speed!!"
Glenn squinted at the screen. "Hmmm, 54.8 mph," he observed.
"How about that?" I asked rhetorically, "have the ol' legs still got it or what?" I was inordinately pleased with myself. I mean, 54.8 mph is FAST.
Now you have to understand that Glenn and I are old friends. We've been buddies for a quarter century. But when it comes to skiing, we can be a little, well, competitive. I was basking in the glow of my achievement as Glenn sauntered back to the kitchen. He stopped part way, turned and came back to where I was sitting.
"Let me look at that again," he asked.
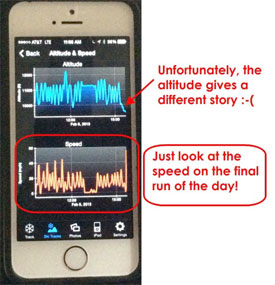
I held up the iPhone. "See," I said pointing out the value in the Max Speed field. "54.8 mph! Ha! Eat my snow Glenn!" I pressed the histogram icon. "It even shows when I hit this top speed." I pointed out the spike in the red graph of speed versus time of day. "And look, it was on the very last run of the day!" I said, feeling even prouder of my achievement. "Nearly 55 mph after a whole day of skiing! Have I still got it, or what?"
You've Got a Bad Altitude
 Glenn peered a little closer at the screen. "What's the graph above it?" He asked, one eyebrow raised.
I turned the phone around and looked.
"It's the altitude of the run," I said.
Glenn smiled "Ok, Franz Klammer," he said, "can you tell me how come your fastest speed of the day was at the lowest altitude? ...and at a lower altitude than the base area of Breckenridge resort?"
I looked more closely at the two graphs as Glenn wandered back to the kitchen.
He called out as he poured his coffee, "you don't happen to remember what the speed limit was on the road out of the ski area, do you? ...55 mph wasn't it? I don't recall myself..."
The Moral of the Story (two morals really)
Moral One: Looking at only one metric for your software productivity measurement can be very misleading. Even if the metric is accompanied by a cool line graph or histogram, it may not be telling you the whole story. You may need to look at other metrics to get the context and be able to correctly analyze the situation.
Moral Two: Before you use performance metrics to perform software benchmarking or to publicly brag on yourself, you might want to check to see that they really, truly represent your actual performance.
A Postscript
As embarrassing as that was, I was glad I didn't leave Ski Tracks on during my flight back to Chicago. Somehow, even I couldn't claim the dramatic process improvement of hitting 500 mph at an altitude of 35,000 feet!
