Basing plans on actual past performance is a core principle of any successful enterprise. Try imagining sales, revenue forecasting, budgeting or inventory management without this vital context. Managing a software portfolio and planning for ongoing development activities should be no different. Earlier in this series we identified three problem areas for software projects: budget (cost), schedule, and staffing. Measurement by itself does not resolve any one of these issues; but it does provide the basis upon which informed decisions can be made.
The ancient philosophical imperative of “Know thyself” applies to organizations, too. Let’s look at some examples of how software measurement can be used to determine present capabilities, assess whether project plans are feasible, and explore trade-offs if they are not. For these examples we have constructed a series of trends based on an organization’s historical project data.
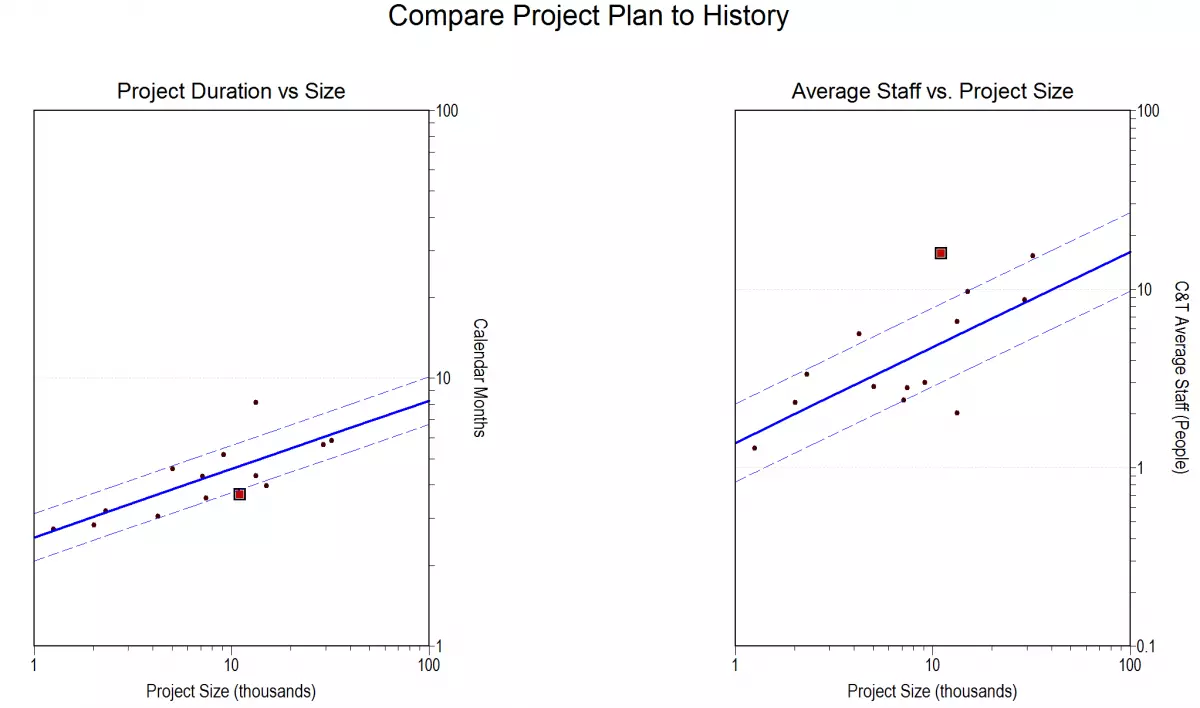
In our example, management wants: a project that completes in 5 months with an average staff of no more than 10 persons. The following graphic contains two scatterplots, each of which has trend lines based on the organization’s history. The blue dots represent the completed projects used to create these trends. A good (feasible) plan will be consistent with historical performance.
The graph on the left compares project duration (how long the project lasted) with size (how much software was developed and delivered). The right hand graph compares average staff to project size. On both graphs the dark line in the middle represents the average and the dotted lines are one standard deviation above and below average. Roughly 2/3 of projects are contained within the inner and outer lines.

In this example we have assumed average productivity (based on the organization’s history) and constrained the project plan (red square) to complete in 5 months. The organization’s history indicates that only once have they completed a project of this magnitude in 5 months. This plan would require over 20 full time staff, something the organization had not previously attempted. In short, the project plan is not feasible. While this may not be welcome news, it is far better to receive it now rather than learning it after the fact.
Considering Alternatives
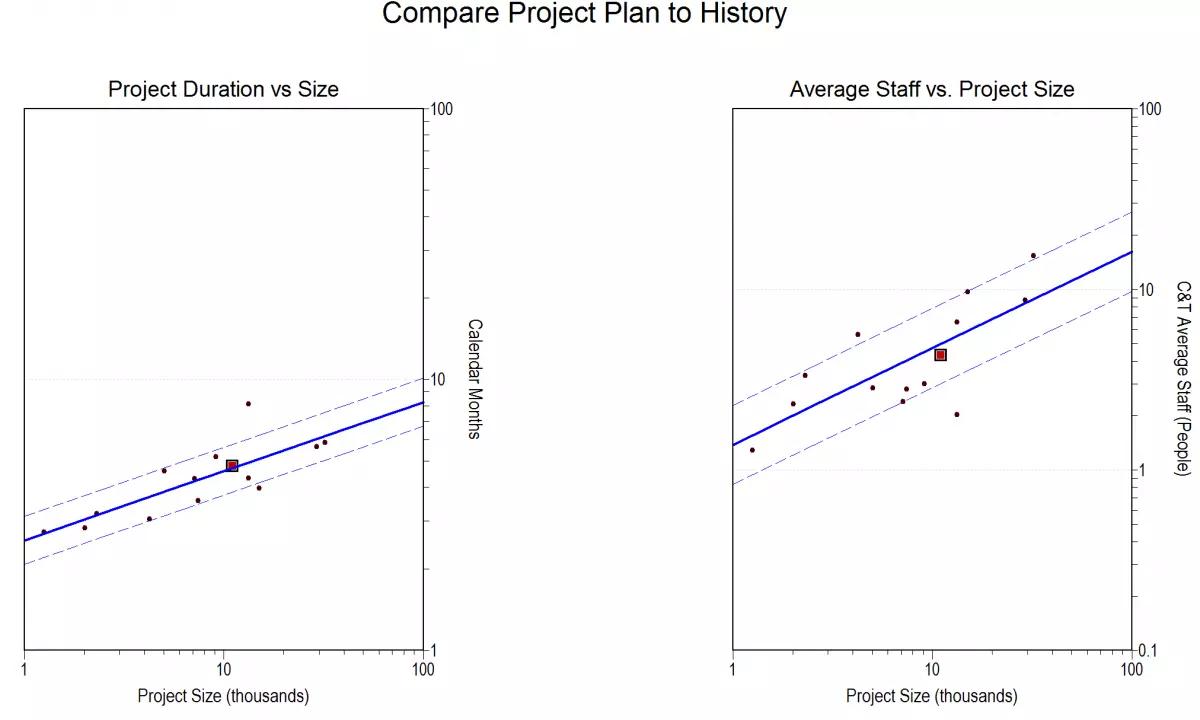
When confronted by a situation like the one above, there are three possible courses of action: extend the schedule, reduce project scope (features), or add staff. In this case adding staff is not a practical solution since the staff required to complete the project in 5 months is already well outside of historical performance. Reducing scope may be a viable alternative if some of the functionality can be deferred or eliminated. By far the best solution is to relax the schedule and allow the project more time to complete, which will allow the project to be planned with a smaller staff. Let’s look at the impact of planning for the project to complete in 6-1/2 months.

This plan is consistent with the organization’s history: both project schedule and staff are very close to average. It is clearly within the organization’s capability to deliver this project in 6 ½ months with a staff of less than 10, while attempting to do it in 5 months with a larger staff would invite failure.
Wrapping it all up
The examples above illustrate what can be done with software project metrics. The principles upon which measurement-based software management are based are not complex. The real challenges lie in collecting the data and, above all, in using it as the basis for decision-making.
