Katie Costantini's blog

Katie Costantini's blog

Top 25 Programming Languages since 2008
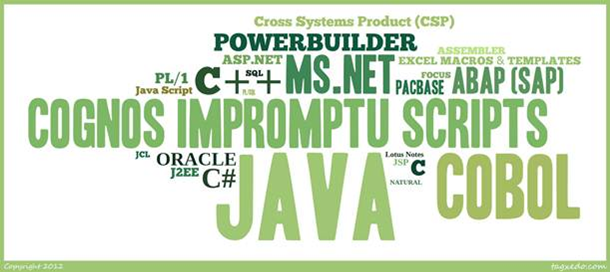
Top 25 Programming Languages since 2008

In response to my previous post, I made a new word cloud for the top 25 programming languages in the QSM historical database from 2008 to present.

One striking difference between this word cloud and the last week's is that the font sizes are much smaller, due to the smaller sample size. Since word clouds use font size to represent size within a sample, this is expected since the entire QSM database is larger than the sample from 2008 to present. 

Unlike last week's cloud, Java is the predominant programming language since 2008. Java represents 26% of the sample since 2008 while COBOL, the #1 programming language in the entire database, holds only 11% of this sample. According to Langpop.com, a site which ranks the popularity of programming languages using search results, Java ranks second in the Normalized Comparison chart, just below C.  

In Programming Language Trends: An Empirical Study, a paper from the New Jersey Institute of Technology, the authors attempt to predict the popularity of programming languages by using regression analysis which focuses on intrinsic and extrinsic factors.  

Blog Post Categories 
Languages QSM Database

Top 25 Programming Languages Visualized

Top 25 Programming Languages

Since I began working with SLIM-Metrics and the QSM historical database, I've been interested in unique ways to present information.  I've written before about how others pair data and design to visualize patterns, but this is my first attempt: a word cloud.  

A word cloud is a graphical representation of how often a word is used within a sample.  The larger the font in the word cloud, the more often it is used in the sample.  Word clouds are a great tool for displaying sensitive data without having to use numbers.  The above word cloud visualizes the entire QSM database, going back three decades.

What I like about this visualization is that at a glance, you can tell that more projects use PL/1 than Natural, simply by examining font size.  Even without knowing exactly how many Java projects are in the QSM database, you can still determine that it's more than Visual Basic, but less than COBOL. 

Unsurprisingly, COBOL still has a large market share in the QSM database.  Most COBOL projects completed after 2000 were maintenance projects, not new development. 

Blog Post Categories 
SLIM-Metrics Languages QSM Database

What's Left Behind When Your Project Is Over

The 2012 Olympics are over and it will be another four years until we can all discuss how much we hate NBC's coverage.   Susy Jackson of the Harvard Business Review blog points out in her blog post  that while the games of years past have been huge spectacles  of debt, the London Olympics have attempted to be "green," in that many of the structures built for the 2012 games will be reused for the 2016 Rio games and other events.  Instead of building permanent structures that will be abandoned shortly after the games are over (HBR mentions the " temporary arenas still standing in tatters in Beijing, frogs inhabiting an abandoned training pool in Athens, a forgotten ski jump resting quietly in Italy"), the London Legacy Development Corporation attempted to reuse about one-third of all structures created for the games. 

Naturally, this inspired me to find the link between the Olympics and software development.  

One commenter Uri writes:

I think there is much more than buildings that are left behind. There is huge pull of amazing skills, knowledge, technological advancements which if planned and used properly can prove to be a bigger and much more sustainable contribution. However, putting these into use may require more thinking and planning then the reuse of infrastructure.

Blog Post Categories 
SLIM-DataManager

Taking Responsibility for Quality Data

Thomas C. Redman recently wrote about data quality on the Harvard Business Review blog.  In his post, he creates a vignette of an executive who finds an error in data provided by the "Widgets Department" for an important meeting. The executive corrects the error, the meeting is a huge success, and the story ends there. Redman argues that someone should have gone back to the Widgets Department to report the error, not to complain that the error could have ruined the presentation, but rather that it could ruin the next person's presentation.

The hardest part about database validation is not reviewing every individual project, but rather, determining if the information on each tab is correct. Sometimes, it's easy to tell that the organization name is spelled incorrectly, other times, it's difficult to discern if a labor rate is incorrect. Having a well-documented database is important, not just for your own use, but for whatever you plan on using it for next.  For example, if you plan on making custom trend lines, but you recorded that it took you 31 man months instead of 3.1 man months, that would have a disastrous effect on your trends! It's obvious that the error would need to be recorded, but it's also important to report the error to whoever prepared the data so that they can check the rest of the projects in the database for the same error. 

Redman suggests creating an office culture which promotes the following three points:

Blog Post Categories 
Data SLIM-DataManager

Data is the New Soil

David McCandless gave a TED talk  in July 2010 that focused on pairing data and design to help visualize patterns.  In his talk, McCandless takes subsets of data (Facebook status updates, spending, global media panic, etc.) and creates diagrams which expose interesting patterns and trends that you wouldn't think would exist.  Although the focus of McCandless' talk was about how to effectively use design to present complex information in a simple way, I was struck by his own claim that data is not the new oil, but rather that data is the new soil.  For QSM, this is certainly true!

QSM maintains a database of over 10,000 projects with which we are able to grow a jungle of ideas, from trend lines to queries about which programming languages result in the highest PIs.  With  the amount of soil that we have, we are able to provide insight into the world of software, just with the data that is graciously provided by our clients.  By collecting your own historical data in SLIM-DataManager, you can create your own trend lines in SLIM-Metrics to use in SLIM-Estimate and SLIM-Control, analyze your own data in SLIM-Metrics, tune your defect category percentages and calculate your own PI based on experience in SLIM-Estimate, and much, much more. 

Creating an Effective Project Closure Checklist

After one particularly difficult midterm in college, my professor said, "This is just a wakeup call; there's still time to improve before the final." I think that wakeup call was particularly painful, but my professor's words stick with me today, especially when thinking about data collection (or lack thereof) when a project is over.

As someone who is not a project manager, it was difficult for me to understand why project managers would not collect their own historical data. I understand now that after a project is finished, people move on to the next project and there's no time to update project stats. Recently, I read a post on Gantthead.com by Kenneth Darter called, Project Closure: Party or Post-Mortem?. Darter says if the project was a success, then it's important to record why it was successful; if the project was not successful, it's important to capture why it was not successful.

The word "data" in Latin literally means "things having been given." At the end of a project, you have been given a lot of things that only you and your team know: size, effort, duration, staffing, PI, cost, etc. If you are able to take a moment to fully document your project information, you not only build a historical database, but you're able to reflect back on that project to improve future endeavors (whether you would like to remember it or forget it completely). Darter recommends creating a checklist which, "should be defined early on in the project and communicated to everyone who will have input into the checklist at the end of the project." In addition to project specific information, he specifically recommends these three items:

Blog Post Categories 
SLIM-Control Data

Demand the (Right) Right Data with SLIM-DataManager

A few weeks ago, Thomas C. Redman posted Demand the (Right) Right Data on the Harvard Business Review blog, about how managers should set the bar higher, in terms of data.

Why are managers so tolerant of poor quality data? One important reason, it seems to me, is that most managers simply don't know that they can expect better!  They've dealt with bad data their entire careers and come to accept that checking and rechecking the "facts," fixing errors, and accommodating the uncertainties that using data one doesn't fully trust are the manager's lot in life.

Although Redman suggests that managers should demand higher quality data, I immediately thought about how to check the quality of SLIM-DataManager databases using the Validate function and SLIM-Metrics.

If you're using SLIM-DataManager to create your own historical database, you can use the Validation feature to help you demand the (right) right data.  The Validation feature in SLIM-DataManager analyzes the projects in your database, highlights suspect projects, and offers a brief explanation tool tip.  Simply go to File|Maintenance|Validate to run this feature and wait for SLIM-DataManager to analyze your database.  If SLIM-DataManager detects anomalies, it will highlight that project in blue.  If you hover over that project, a tooltip will explain what is wrong with that project data and what you need to take a second look at.

Losses Loom Larger Than Gains

Anyone who has gambled (and lost) knows the sting of losing.  In 1979, Daniel Kahneman and Amos Tversky, pioneers in the field of behavioral economics, theorized that losses loom larger than gains; essentially, a person who loses $100 loses more satisfaction that what is gained by someone who wins $100. Behavioral economics weaves psychology and economics together to map the irrational man, the foil of economics' rational man. 

How can I leverage this theory for software development?

According to the QSM IT Software Almanac (2006), worst in class projects took 5.6 times as long to complete and used roughly 15 times as much effort with a median team size of 17, and were less likely to track defects. 

One way you can leverage your worst in class projects would be to use them as history files in SLIM-Estimate, which would adjust PI, defect tuning, etc., to match how you have developed software in the past. Don Beckett recently discussed how to tune effort for best in class analysis and design.

Another way to leverage your worst in class projects would be to build a "project graveyard," that is, a database of your organization's worst projects, and load it into SLIM-Metrics. In SLIM-Metrics, you can analyze duration, peak staff, average staff, and defects to view your own organization's weaknesses. Depending on how well documented your SLIM-DataManager database is, you could analyze some of the custom metrics that ship with SLIM-Metrics, such as reviewing who the project was built for (customer metric) and complexity.

Blog Post Categories 
SLIM-Metrics SLIM-DataManager