Software Estimation Best Practices

Blogs

Estimating Agile Projects Webinar

On Thursday, September 30th at 1 pm EDT, QSM will host a Webinar on Agile Estimation Methods.

You can view the replay of this webinar here.

   
Description:
Agile has become a popular development methodology in software and systems development in recent years, but how do we tailor our estimation processes to this new methodology? Traditional methods do not apply in terms of project sizing and planning. How can we find an accurate point of comparison with industry trends? Presented by industry veteran Larry Putnam, Jr., QSM takes you through the basic steps on how to customize the estimation process to Agile.

Lawrence H. Putnam, Jr., Co-Chief Executive Officer of QSM, has 21 years of experience using the Putnam-SLIM Methodology. He has participated in more than 80 estimation and oversight service engagements, and is responsible for product management of the SLIM-Suite of measurement tools and customer care programs. Larry is a member of and active participant in numerous organizations, including the Quality Assurance Institute, Software Program Managers Network, International Function Point Users Group, and International Society of Parametric Analysts. Larry has delivered more than 27 speeches at conferences on software estimation and measurement, and has trained – over a five-year period – more than 1,000 software professionals in the use of the SLIM-Suite.
Blog Post Categories 
Webinars Estimation Agile

Part III: How Does Duration Affect Productivity?

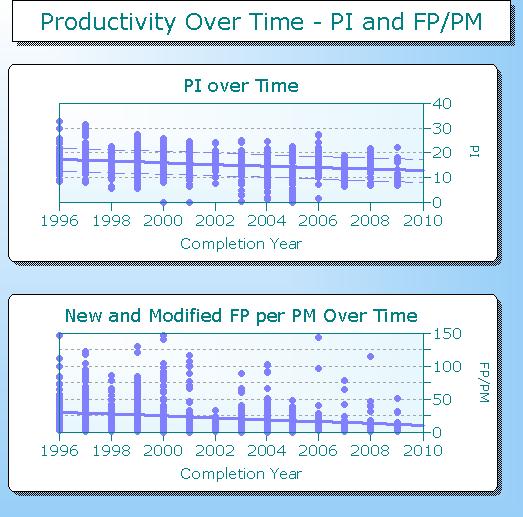
This week we turn to another question triggered by the Performance Benchmark Tables: how does duration affect productivity? To many managers, project schedule and cost are equally important. There are significant tradeoffs involved: if the project takes too long, important market opportunities may be lost. But adding people to compress the schedule can drive up cost dramatically. For this reason, QSM uses a productivity metric that explicitly accounts for duration: the Productivity Index (or PI). Unlike ratio based productivity measures, the PI is a three dimensional measure that adds duration to the traditional size/effort equation. It explicitly accounts for the distinctly non-linear relationships between size, effort, and time.  To see the benefits of this approach, let’s look at how project duration relates to simple (SLOC/effort) productivity.

Continue reading...


Blog Post Categories 
Productivity

Part II: Team Size and Productivity

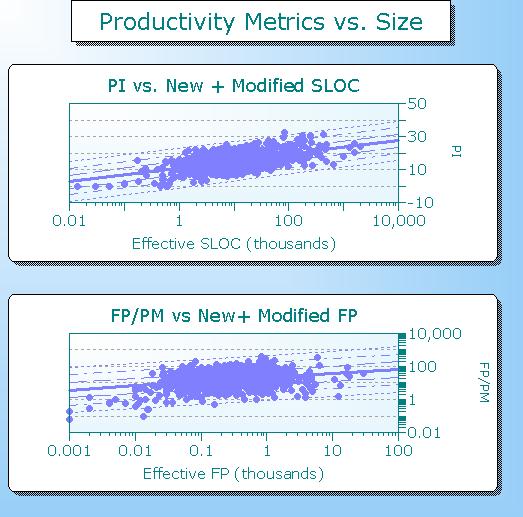
In Part I of this series, we demonstrated that average productivity (effective size/effort) increases with project size. This relationship holds true across the size spectrum whether we’re talking about projects in the very small range or projects that deliver a million lines of code. Above this cutoff, the sample size is too small to be definitive.

But productivity isn't the only metric that increases with project size. On average, large projects use more effort, take longer, and use bigger teams.  How can these results be reconciled with previous studies which conclude that the large team strategy results in lower productivity? It would seem that we have a contradiction on our hands.


Blog Post Categories 
Productivity

SLIM-Estimate and IBM Rational Focal Point Integration Now Available

QSM and IBM Rational are pleased to announce yet another point of integration between SLIM and Rational tools.  Most projects overrun their schedules and budgets because of the lack of good estimates at the time commitments are made.  Project and portfolio management tools like Rational Focal Point are useful to analyze proposals and help build a solid business case on which to base project approvals.  These products focus primarily on justifying the project through the business benefits and/or savings derived from the implementation of the proposal’s business requirements.  They do not assess the risk of failing to meet a business stakeholder’s desired project schedule and budget in a proposal.  QSM’s integration to Rational Focal Point brings this powerful capability to market and helps identify high risk proposals before they enter an organization’s project stream.  This capability can significantly reduce schedule slippage and cost overruns that can reach tens of millions of dollars for many large Fortune 1000 organizations.

Read more about the SLIM-Estimate and Rational Focal Point integration here or you can read more about QSM's IBM Rational Solutions on our Partners Page.

Blog Post Categories 
SLIM-Estimate IBM Rational

The Size-Productivity Paradox, Part I

From time to time, questions from clients get us thinking:

After yesterday's Web presentation on the QSM Benchmarking Consortium, I went to your Web site and found the paper "Performance Benchmark Tables." I noticed the delivery rates in both SLOC/PM and FP/PM numbers increase as average project size increases. This seems counterintuitive: are the Performance Benchmark Tables correct?

That's a great question. Our data definitely shows an upward trend in productivity as application size increases. This is true whether we use measures like QSM's PI (productivity index) or ratio based productivity measures (SLOC or FP per person month of effort). The QSM industry benchmark trends behave similarly: as projects get larger, average productivity increases as well.

Paul Below recently took another look at productivity data using several popular statistical software packages. The question he was trying to answer was, “Does productivity (measured as SLOC/PM) always increase with system size, or could the size-productivity relationship actually behave differently in certain regions of the size spectrum?" To answer this question he used something called residuals to evaluate the size/productivity regression trend.

Blog Post Categories 
Productivity

Code Counters and Size Measurement

Regardless of which size measures (Effective SLOC, function points, objects, modules, etc.) your organization uses to measure software size, code counters provide a fast and easy way to measure developed functionality. If your organization uses Effective (new and modified) SLOC, the output from an automated code counter can generally be used "as is". If you use more abstract size measures (function points or requirements, for example), code counts can be used to calculated gearing factors such as average SLOC/FP or SLOC/requirement.

The QSM Code Counters page has been updated and extended to include both updated version information and additional code counters. Though QSM neither endorses nor recommends the use of any particular code counting tool, we hope the code counter page will be a useful resource that supports both size estimation and the collection of historical data.

Blog Post Categories 
Benchmarking Software Sizing Estimation

QSM Database Update

It’s time to update QSM’s industry trends and we need your help! Contributing data ensures that the database reflects a wide spectrum of project types, languages, and development methods. It helps us conduct ground-breaking research and improve our suite of estimation, tracking, and benchmarking tools. Contributors benefit from the ability to sanity-check estimates, ongoing projects, and completed projects against the best industry trends in the business.

 We're validating over 400 new projects, but we can always use more – especially in the Real Time, Microcode, and Process Control application domains. So what do you need to do to ensure your firm is represented in the next trend line update? That’s easy! Simply send us your DataManager (.smp files) or completed SLIM-Control (.scw) workbooks. Here’s the recommended minimum data set:

  • Project Name
  • Status = “Completed” only – no estimates or in progress projects
  • Application type and sub-type (if applicable)
  • Phase 3 time. Can be calculated from the phase end/start date or entered as a value (e.g.: 3.2 months)
  • Phase 3 effort
  • Effective Size (the number of new and or modified functional size units used to measure the application – objects, SLOC, function points, database tables). Please include a gearing factor if the project was sized in something other than Source Lines of Code

Additional information allows us to perform more sophisticated queries:

Blog Post Categories 
QSM News

Replay Now Available for QSM's High Performance Benchmark Consortium Webinar

Our recent webinar, "Introduction to the High Performance Benchmark Consortium," was a great success and we are already looking forward to planning our next presentation.  Joe Madden received a lot of insightful questions regarding our new consulting program.  We are aware that your time is valuable and scheduling can be a challenge, so we have recorded a replay, including Q&A, for anyone who was unable to attend the scheduled webinar.


To view the replay, click here.


Blog Post Categories 
Webinars Benchmarking Consulting

High Performance Benchmark Consortium Webinar Announced

I am pleased to announce that on Thursday, February 25 at 1:00 PM EST, QSM will be hosting a webinar based on our new High Performance Benchmark Consortium.

QSM has introduced a program specifically designed to help software development or acquisition organizations quantify and demonstrate performance improvement over time. The High Performance Benchmark Consortium is for clients who want to be best in class software producers and are willing to be active participants in the program. In today’s economic environment it is more important than ever for both suppliers and acquirers to compete more effectively and provide value to their customers. Members of the Consortium gain access to proprietary research that leverages the QSM historical benchmark database of over 8,000 validated software projects.

Presented by benchmarking expert and head of QSM Consulting, Joe Madden, this webinar will discuss:

  • the major components of the program
  • the different levels of membership participation
  • the benefits of being a member
  • sample deliverables that a typical member would receive

To register for this event, simply follow this link and click "Register."

Blog Post Categories 
Webinars Benchmarking

Performance Benchmarking Tables

QSM consultant Paul Below has posted some quick performance benchmarking tables for IT, engineering class, and real time software.

The tables contain average values for the following metrics at various size increments:

Schedule (months)

Effort (Person Months)

Average Staff (FTE)

Mean Time to Defect (Days)

SLOC / PM

Two insights that jump out right away:

1. Application complexity is a big productivity driver. IT (Business) software solves relatively straightforward and well understood problems. As algorithmic complexity increases, average duration, effort, team size increase rapidly when compared to IT systems of the same size.

2. Small teams and small projects produce fewer defects. Projects over 100 effective (new and modified) source lines of code all averaged Mean Times to Defect of under one day. We see this over and over again in the QSM database: small projects with small teams consistently produce higher reliability at delivery.

Blog Post Categories 
Benchmarking