Software Estimation Best Practices

Blogs

Webinar - Using Benchmarking to Quantify the Benefits of Process Improvement

On Thursday, Feb. 7, at 1:00 PM EST, Larry Putnam, Jr. will present Using Benchmarking to Quantify the Benefits of Process Improvement.

With increasing pressure to improve quality while cutting costs, process improvement is a top priority for many organizations right now; but once we've implemented a process improvement initiative, how do we accurately measure the benefits? Benchmarking is critical to determining the success of any serious process improvement program. As with any type of measurement program, it requires an initial reference point to measure progress. To set our point of comparison, we first need to perform a benchmark on a contemporary sample of projects that are representative of the typical work that we do. In this webinar, industry expert Larry Putnam, Jr. will take you through the necessary steps to perform a successful benchmark - from collecting quantitative and qualitative data to establish the initial baseline benchmark all the way through to performing follow up benchmarks on new projects and process improvement analysis.

Larry Putnam, Jr. has 25 years of experience using the Putnam-SLIM Methodology. He has participated in hundreds of estimation and oversight service engagements, and is responsible for product management of the SLIM Suite of software measurement tools and customer care programs. Since becoming Co-CEO, Larry has built QSM's capabilities in sales, customer support, product requirements and most recently in creating a world class consulting organization. Larry has delivered numerous speeches at conferences on software estimation and measurement, and has trained - over a five-year period - more than 1,000 software professionals on industry best practice measurement, estimation and control techniques and in the use of the SLIM Suite.

Blog Post Categories 
Webinars Benchmarking Process Improvement

All About Bar Charts and Histograms

Having data is great, but if you don't understand how to display it, you can't get your point across.  The focus of this blog series is to explain the various chart types available to you in SLIM-Metrics so that you can efficiently analyze your data, as well as to provide helpful tips and tricks. 

Bar charts break a data set into bins or categories and provide the number/percent of projects or the average metric value for each category.

Unlike scatter plot charts, bar charts can display both numeric and text metrics. There are two metrics tabs on a bar chart property sheet — one for the independent and one for the dependent metric. To create a bar chart, highlight the independent and dependent metric you want to display and select Choose, or simply double-click the desired metric. Once chosen, the selected metric name appears in the field to the right of the Choose button. 

Histograms

Histogram

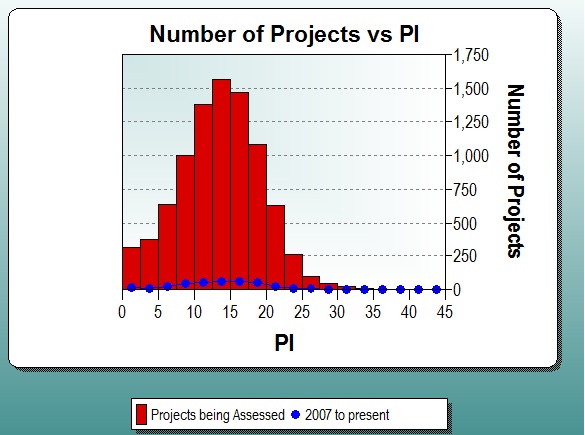
Histograms display continuous numeric data (each bar spans the interval between dependent axis ticks) grouped into evenly spaced bins on the independent axis, for the first data set. Additional data sets are overlaid over the bars in a line style with symbols. The Bin Size or Number of Bins can be customized, or you can select Auto to accept the default bin settings.

Histograms show both values and distributions, which is an important way of evaluating single summary statistics, such as averages.  For example, if a PI histogram follows a normal distribution, then you can probably use the average PI for estimation.  If a PI histogram does not follow a normal distribution, then it is a good idea to choose a different method to pick PI.

Blog Post Categories 
SLIM-Metrics Tips & Tricks

Agile Series Part 4: How Software is like a Marshmallow

It’s tempting to do things that you shouldn’t.  In software development, unrealistic deadlines and changing requirements often lead teams to make counterproductive decisions, such as adding additional staff in order to achieve a deadline.  This not only creates more defects on the current project but also takes resources away from other projects.  

I recently faced a similar dilemma when deciding whether or not to indulge in the holiday treats in the office breakroom.  Should I consume the sugary snacks that taste delicious but have the potential to cause obesity (among other health consequences) or should I eat the banana I brought with me?  Perhaps to me, this internal debate became exaggerated after reading Kidd et al.’s (2013) study and watching the accompanying video on environmental stability and satisfaction.  However, after some thinking, and more indecision on my snack choice, I came to the conclusion that software is like a marshmallow.

Blog Post Categories 
Agile SLIM-MasterPlan

Abyi Yeshigeta Joins the QSM Consulting Team

QSM's best in class consulting team continues to grow with talented and dedicated individuals. We are pleased to welcome Abyi Yeshigeta as a Project Consultant supporting the Department of State Consular Affairs (CA) Consular Systems Technology (CST) engagement team on-site in Washington, DC. Abyi holds a BBA in Business Management from James Madison University and is a PMI certified Project Management Professional (PMP) with DoD Defense Acquisition University training (DAU 101). Abyi brings five years of management consulting experience to include program and project management support, test and evaluation, and independent reviews/audits.

Experienced consultants like Abyi allow us to understand your business challenges quickly and identify effective solutions. Learn more about QSM consulting services today!

Blog Post Categories 
Consulting QSM News

SLIM Note Panel Simplifies Reports, Documentation, and Guidelines

SLIM Suite default workbooks contain pre-defined views you can customize to fit your reporting needs.  The Navigation Panel on the left side of the user interface displays the list of views, organized into sections or folders.  Each SLIM tool contains multiple views to facilitate presentation and analysis of the unique metrics it employs.

Navigation Panel
Figure 1: Navigation Panel

One of the most valuable and flexible objects to include in a view is the Note Panel.  Just as it sounds, it is simply a note pad where you can include descriptive text about estimation assumptions, findings, questions, instructions to SLIM users.... the possibilities are numerous.  QSM uses the Note Panel to provide instructions, tips, and easily customizable project and executive summary reports.  The view below shows the Section Purpose & Operating Procedures view, which describes other views in the folder, along with suggestions for tailoring subsequent charts and reports. 

Note Panel View
Figure 2: Note Panel View

You can use notes to document the estimation procedure you want others in your organization to follow.  Use notes to document the special background information that explains why the recommended solution meets the most important project goals and constraints.

Blog Post Categories 
SLIM Suite Tips & Tricks

Why Are Conversion Projects Less Productive than Development?

While doing research on projects counted in function points, the sample size was large enough (over 2000 projects) to allow me to compare the productivity of different project types.  The QSM database uses these project categories:

  • New Development (> 75% new functionality)
  • Major Enhancement (25% - 75% new functionality)
  • Minor Enhancement (5% - 25% new functionality)
  • Conversion (< 5% new functionality)
  • Maintenance

I calculated the normalized PI’s for projects in each development classification compared to the QSM Business trend lines.  The advantage of this is that it takes into consideration the impact of size and shows how the productivity of each project “application type” differs from the QSM Business IT average.  The datasets included medium and high confidence IT projects completed since 2000.  When I obtained the results, I went back over my selection process and calculations to make sure I hadn’t made a mistake.  The numbers were that surprising.  But, no, I hadn’t fat fingered anything (neither physically nor mentally).  Average productivity for conversion projects  was more than a standard deviation below the QSM Business IT average.

Blog Post Categories 
SLIM-Estimate Function Points Database

Agile Series Part 3: Embrace Change

“The only thing that is constant is change” ~Heraclitus

This proverb is often told to individuals (like me) who love to see a project follow a plan from start to finish.  I’ll be honest, I’m a planner. I’m thrilled when the plans I put in motion actually work out the way I intended.  These are the moments when I retort, “the only people who like change are wet babies.” However, more often than not, something changes, which throws off my entire plan and forces me to not only revisit Heraclitus’s proverb but also rethink my plan entirely.

Building software, particularly in Agile development, is no exception. In fact, the second principle of the Agile Manifesto states that developers should: “Welcom[e] changing requirements, even late in development. Agile processes harness change for the customer’s competitive advantage.”

It would seem, then, that this principle would disappoint any planner working on an Agile team. Why bother creating a development plan if you know the stakeholders are going to change their minds about their desired features at the last minute? While we’re on this subject, if the requirements are going to change from one iteration to the next, why bother estimating the project at all?

Blog Post Categories 
SLIM-Control Agile

Effort: What's Behind that Number?

Effort seems like a metric that's very straightforward, but there is a lot of complexity here, particularly if you are performing benchmark analysis. Recently, I was tapped to help out with a benchmark assessment. One of the metrics that the customer wanted to analyze was effort per function point. "Effort" on its own is very vague, and while the customer might know which phases or activities his organization uses, I can't be sure that definition will match what I think he wants. In order to effectively benchmark, we need to make an apples-to-apples comparison by examining what is really behind the effort number, so it was necessary to send the client phase and activity definitions. 

Here are some helpful definitions to help you understand which activities are included in each phase: 

Concept DefinitionThe earliest phase in the software life cycle, where complete and consistent requirements and top-level, feasible plans for meeting them are developed.

The objectives of this phase are to develop a complete and technically feasible set of requirements for the system and to formulate the top-level approach and plan for their implementation.  Typical products of these activities include:

Blog Post Categories 
Benchmarking Effort

Data Myths

In a post for The Guardian's Datablog, Jonathan Grey explores the rise of data journalism. Data journalism is "a journalistic process based on analyzing and filtering large data sets for the purpose of creating a new story. Data-driven journalism deals with open data that is freely available online and analyzed with open source tools. 

Although data is a powerful tool, Grey reminds readers that it's not a silver bullet and counters some commonly held data myths. 

Data is not a perfect reflection of the world.

Blog Post Categories 
SLIM-Metrics Data SLIM-DataManager

Process Improvement and the "Normal" Project

When I think about software projects, my memory goes back to the large ones I worked on when I was a developer.  These projects lasted for many months and usually had teams that were divided into sub-teams that worked on specific areas of functionality.  They typically created major systems for the customer.  But was that the normal life of a software developer?  Not really.  Years were spent on production support handling change requests, while the many small projects we completed are now only vague memories.

Recently, for some research I am doing on function points, I worked with a database of over 2000 recently completed software projects. As a byproduct of that research, I was able to come up with a portrait of the “average normal” Business IT project that I would like to share.

  • The normal project is not new development.  In fact, only 16% of recently completed IT projects in the database were new development.
  • 75% were either major or minor enhancements.
  • Median project duration from the beginning of analysis until implementation was 7 months.
  • Median effort was 22 person months (or 3520 hours at 160 hours per person month)
  • Average staff (team size) just over 3 FTE people.
  • Average size – 160 unadjusted function points.

While there is nothing earth shattering in these numbers, I saw a disconnect between the typical, relatively small project and massive lifecycle methodologies and process sets, such as CMMI, that are designed for BIG projects.  These processes and methods usually make some effort to be scalable; but the time and effort required to understand and scale them appropriately is a significant endeavor all by itself!  

Blog Post Categories 
Function Points Process Improvement