Quantifying software project risk and having a systematic way of accounting for it in software estimates helps firms determine how much contingency (or management reserve) is needed to protect against factors like scope growth, lower than anticipated productivity, or technical challenges that keep teams from executing project plans as originally intended. When risk mitigation is an explicit part of the software estimate, we can set reasonable client and management expectations and negotiate practical project plans with a higher likelihood of success.
Dealing with Uncertainty
At the time most software estimates are performed, detailed design is incomplete and major decisions about how the system will be designed, coded, tested, and delivered have not yet been made. Faced with imperfect information, estimators must supply educated guesses – hopefully based on sound requirements and performance data from completed projects - about the final delivered size, productivity, team size, and schedule. Because the inputs to the estimate are uncertain, the final outcomes are also uncertain.
When we estimate that a project will most likely take 6 months and 8 full-time staff to execute, we really should say, “Based on our analysis and past performance data, we expect the project to take 6 months and use 8 people, but the schedule could vary by as much as 15% and the budget by up to 20%.” But all too often, clients and management expect “single point” estimates based more on optimism than careful risk analysis.
Estimates are performed because we’re not certain what will happen as the project progresses, yet the business must commit to delivering a fully functioning system within a specified budget and time frame. Resources and funds don’t magically appear just when they’re needed: they must be planned for and secured in advance. The risk is that the final cost, schedule, or quality of software projects in the portfolio may deviate from our original commitments by an unacceptable amount.
To deal with this problem, effective software estimators actively assess estimation uncertainty and use it to manage risk. This approach provides both a workable project plan and a reasonable buffer in case the planned scope, productivity, or staffing deviate from their estimated values.
Plans vs. Contingency
QSM’ SLIM-Collaborate® software estimation tool lets you visualize the impact of various amounts of contingency so you can select an amount that matches the perceived risk. This is accomplished by defining Contingency Profiles − generic formulas that add a specified amount of risk buffer to a project’s estimated schedule, cost, effort, and quality values. Because they are reusable, Contingency Profiles help standardize the calculation of management reserve across your portfolio. Different profiles can be tailored for use with various project or contract types. For example, fixed price contracts usually require more management reserve than in-house maintenance releases or time-and-materials contracts. Large, high-profile projects are riskier than tiny, ad hoc projects. Contingency profiles help estimators calculate appropriate levels of risk protection for each project.
SLIM-Collaborate offers two types of Contingency profiles:
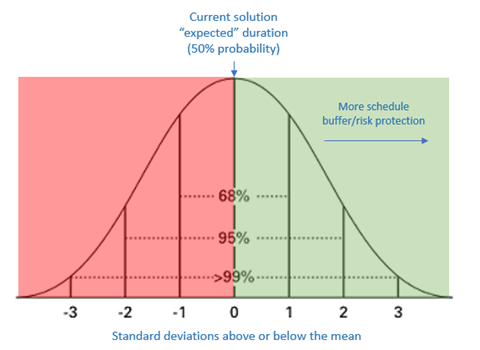
•Target Probability profiles use Monte Carlo simulation to create a probability distribution of potential outcomes, allowing estimators to choose higher assurance (risk buffered) “commit-to” values for various management metrics. They are most appropriate when you want to scale management reserve to estimation uncertainty.
•Fixed Percentage profiles add a fixed buffer (example, 20% on effort, 10% on schedule) to an existing estimate. They are most appropriate when you want to calculate management reserve based on project/contract type or corporate policy.
Target Probability profiles use the uncertainty surrounding your software estimation inputs (productivity, labor rate, and size) to generate a sampling distribution of likely effort, cost,
quality, and schedule outcomes. The width of this distribution is driven by the uncertainty surrounding your estimation inputs — software size, productivity, and labor rate. As you move the uncertainty sliders from left (lower uncertainty) to right (higher uncertainty), a 99% confidence range for each metric value is calculated and displayed in the hover tips for each slider. This range is used during Monte Carlo simulation to vary each input within its associated uncertainty range and calculate the full range of potential solutions on probability charts and reports.

Once SLIM-Collaborate has generated a distribution of potential outcomes, estimators can display and compare saved target probability profiles on Contingency Dashboard charts and reports. Examples might include:
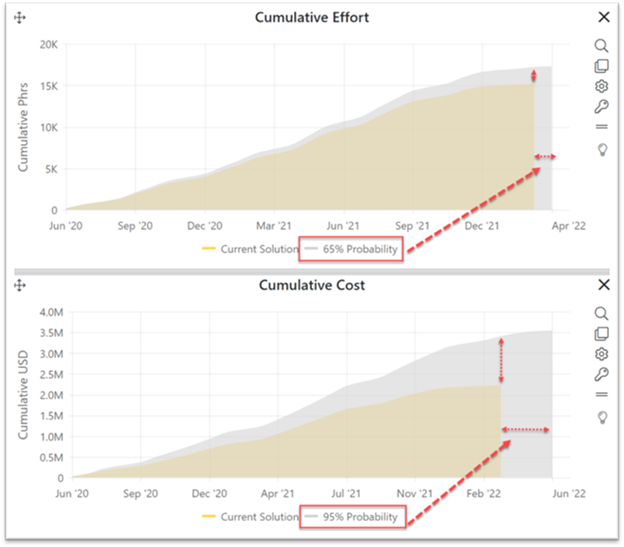
•65% assurance on time and effort. Provides minimal contingency (buffer).
•95% assurance on time and effort. Provides generous contingency (buffer).
In the charts below, the yellow curves represent the current software solution (the expected outcome based on your best estimates for inputs like productivity and final system size). The grey time series curves show the 65% assurance (top chart) and 95% assurance (bottom chart), risk buffered solutions. These “contingency” solutions help estimators visualize and assess the amount of additional contingency needed to allow firms to negotiate commitments that contain a reasonable amount of management reserve.

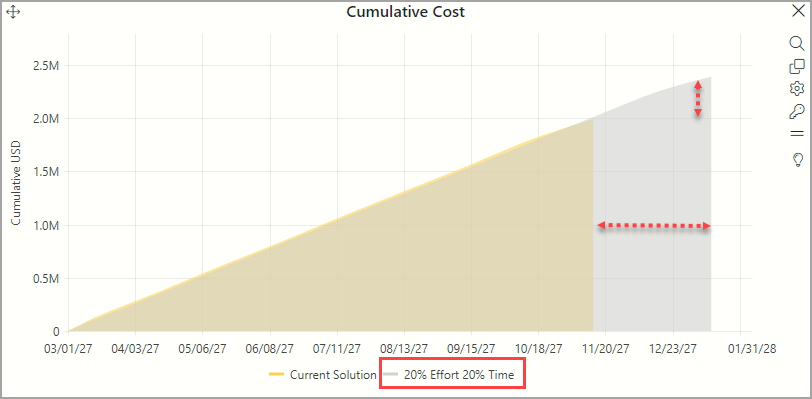
The second type of contingency profile – Fixed Percentage – simply adds a proportional risk buffer to the schedule and effort/cost of an existing estimation service solution. Unlike the Target Probability method, this type of contingency profile doesn’t factor in input uncertainty or use Monte Carlo simulation. Fixed percentage contingency is a straightforward calculation. Applying a 10% schedule/20% cost profile to an estimate will produce the following results:
•If the estimated schedule is 10 months, a 10% fixed percentage schedule contingency adds 1 month (10% of 10 months) of schedule buffer.
•If the estimated cost is $2 million, a 20% fixed percentage cost contingency adds $400,000 dollars (20% of 1 million) of cost buffer.

Summary
Software projects are risky because estimates and commitments often must be made when very little is known. The larger the project, the greater the risk. Uncertainty cannot be totally eliminated but using a scientific method to quantify the uncertainty about the most important assumptions – size and productivity – helps you match project contingencies to the risk, increasing the probability of successful project outcomes.
