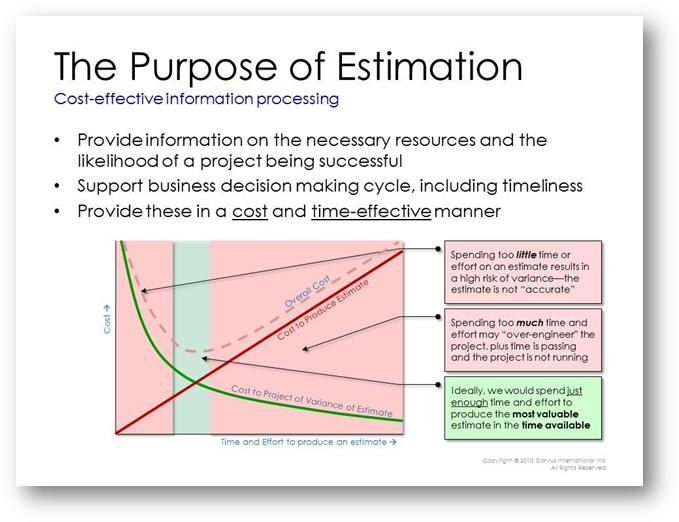
How much time and effort should we spend to produce an estimate? Project estimation, like any other activity, must balance the cost of the activity with the value produced.
There are two extreme situations that organizations must avoid:
The Drive-By Estimate
The drive-by estimate occurs when a senior executive corners a project manager or developer and requires an immediate answer to the estimation questions: “When can we get this project done?” “How much will it cost?” and “How many people do we need?" (the equally pertinent questions: “How much functionality will we deliver?” and “What will the quality be?” seem to get much less attention).
Depending on the pressure applied, the estimator must cough up some numbers rather quickly. Since the estimate has not been given much time and attention, it is usually of low quality. Making a critical business decision based on such a perfunctory estimate is dangerous and often costly.
The Never-Ending Estimate
Less common is the estimation process that goes on and on. In order to make an estimate “safer” an organization may seek to remove uncertainty in the project and the data used to create the estimate. One way to do that is to analyze the situation more and more. Any time we spend more time and more effort in producing an estimate we will generally produce a more precise and defensible result. The trouble is the work we have to do to remove all the uncertainty is pretty much the same work we have to do to run the project. So companies can end up in the odd situation where, in order to decide if they should do the work what resources they should allocate to the project, they actually do the work and use up the resources.
Ideally, the estimation process would hit the Goldilocks “sweet spot” where we spend enough time and effort on the estimate to be confident in the result, but not so much that we over-engineer the estimate and actually start running the project.
The Goldilocks Estimate: Inverse Exponential Value
Generally any uncertainty reduction process (such as inspections, testing, and estimation) follows an exponential decay curve: initially there is a lot of low-hanging fruit—items which are quite clear and easy to find, if only we take the time to look. As we clean up the more obvious issues the remaining ones tend to be more obscure, ambiguous, and difficult to find. Therefore it takes us longer and longer to find each uncertain item be it requirements issue, test case, or project attribute. This is a common finding in testing metrics and SLIM-Estimate models this with its exponential curve in Phase 4 (assuming that the primary function of Phase 4 is to uncover delivered defects—if Phase 4 also includes functional enhancements, installation activities, process improvement initiatives, or other, non-defect finding work, we might choose a different Phase 4 shape within SLIM-Estimate).
The Goldilocks Estimate: Linear Cost
If we simply allocate a certain number of people to producing the estimate and let them work until we are “satisfied” with the result (whatever that might mean), the cost will tend to be linear up and to the right.
The combination of these two graphs produces a U-Shaped profile:

Too far to the left and the likely cost of a poor estimate will be high. Too far to the right and the work done in producing the estimate is not balanced by the value of the estimate. Indeed, to some extent the project is going ahead without its funding and value being reviewed and approved.
The Goldilocks point occurs at the saddle point.
We can actually calculate where this point occurs and just how much time and effort we should expend on producing an estimate. How to do this will be the subject of a later entry on this blog.
