Recently I conducted a study on projects sized in function points that covers projects put into production from 1990 to the present, with a focus on ones completed since 2000. For an analyst like myself, one of the fun things about a study like this is that you can identify trends and then consider possible explanations for why they are occurring. A notable trend from this study of over 2000 projects is that productivity, whether measured in function points per person month (FP/PM) or hours per function point, is about half of what it was in the 1990 to 1994 time frame.
Median Productivity
| 1990-1994 | 1995-1999 | 2000-2004 | 2005+ | |
| FP/PM | 11.1 | 17 | 9.21 | 5.84 |
| FP/Mth | 17.1 | 63.9 | 29.74 | 22.10 |
| PI | 15.3 | 16.4 | 13.9 | 10.95 |
| Size (FP) | 394 | 167 | 205 | 144 |
Part of this decline can be attributed to a sustained decrease in average project size over time. The overhead on small projects just doesn’t scale to their size, thus they are inherently less productive. Technology has changed, too. But, aren’t the tools and software languages of today more powerful than they were 25 years ago?
I want to propose a simple answer to the question of why productivity has decreased: the problems with productivity are principally due to management choices rather than issues with developers. Allow me to elaborate. Measures aimed at improving productivity have focused on two areas: process and tool improvements. What’s wrong with process improvement? Well, nothing except that it is often too cumbersome for the small projects that are currently being done and is frequently viewed by developers as make-work that distracts them from their real jobs. And what’s wrong with improved tools? Again, nothing. Developers and project managers alike are fond of good tools. The point is, however, that neither process improvement nor better tools address the real issues surrounding software project productivity. Here are some reasons:
Coding and unit testing do not comprise the bulk of software project effort. One popular estimate of coding and unit testing on a medium to large project puts these activities at 30% of total project effort. So even if tools and processes make these activities twice as efficient, that will only reduce total project effort by 15%. Simply stated, the bulk of the activities that go into a software project have been ignored by productivity improvement measures.
Misdirected Project Effort. QSM did a study a few years ago in which we compared the productivity, quality, and time to market of projects that allocated more than the average amount of effort to analysis and design with those that didn’t. The average at that time was 20% and has since decreased. The projects that spent more time and effort up front outperformed the other groups in every measure. I repeated this analysis looking only at projects completed since the beginning of 2000 with similar results, (see table below). Since the amount of effort spent in analysis and design has decreased since the first study, this does not bode well for either productivity or quality.
Impact of Effort Spent In Analysis and Design
| Medians | >20% | < 20% | Difference |
| PI | 14.19 | 11.04 | 29% |
| FP/Person Mth | 7.93 | 6.2 | 28% |
| Duration | 6.2 | 7.23 | -14% |
| Total Effort | 20.29 | 22.59 | -10% |
| Average Staff | 2.5 | 2.34 | 7% |
| Size in FP | 171 | 157 | 9% |
| Defects | 19.5 | 20 | -3% |
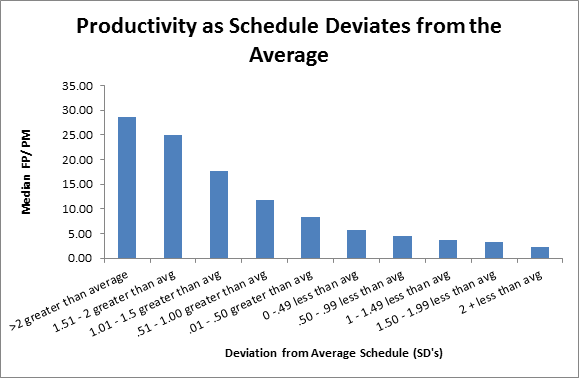
Failure to understand the impact of “aggressive schedules.” I’m being generous here: all too often it is willful ignorance. Schedule pressure is the principal reason project teams don’t spend adequate time in analysis and design. The following table based on over 2000 completed validated software projects shows the impact of schedule on productivity. You get to choose one: quick to market or high productivity; but not both.

The bar chart above shows the median schedule variance measured in standard deviations against median productivity (FP/PM of effort). For example, projects with schedules more than 2 standard deviations longer than average had a median productivity of almost 30 FP/PM while those with schedules more than 2 standard deviations below the average had a median productivity of less than 5 FP/PM.
Choosing between spending more time in analysis and design or between optimizing schedule or productivity are not choices developers make; they are management choices that directly impact productivity and quality. Developers do not control the environment in which their work is done. That decision is made for them. If management really wants to know why productivity is stagnant or decreasing, they need to hold a mirror up to their own faces and say, as in the old Pogo comic strip, “We have met the enemy and he is us."
