This is the second post in a three part investigation of how team size affects project performance, cost, quality, and productivity. Part one looked at cost and schedule performance for Best in Class and Worst in Class IT projects. For this study, Best in Class projects were those that delivered more than one standard deviation faster, but used more than one standard deviation less effort than the industry average for projects of the same size. A key characteristic of these top performing projects was the use of small teams: median team size for best in class projects was 4 FTEs (full time equivalent) people versus 17 FTEs for the worst performers.
What is the relationship between team size and management metrics like cost and defects? To find out, I recently looked at 1060 medium and high confidence IT projects completed between 2005 and 2011. These projects were drawn from the QSM database of over 10,000 completed software projects. The projects were divided into two staffing bins:
- Small team projects (4 or fewer FTE staff)
- Large team projects (5 or more FTE staff)

These size bins bracket the median team size of 4.6 for the overall sample, producing roughly equal groups of projects that cover the same size range. Our best/worst in class study found a 4 to 1 team size ratio between the best and worst performers.
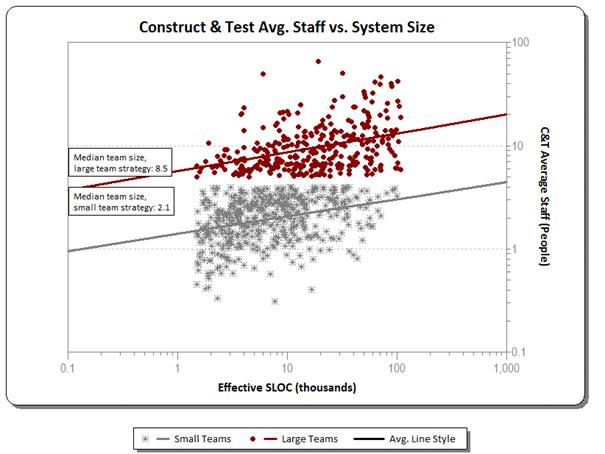
Interestingly, using team size as a selection criterion and including average projects as well as high and low performers produced a very similar team size ratio:
- Large team projects had a median team size of 8.5 FTE staff
- On average, small team projects used only 2.1 FTEs
Note the variability in team size even for projects of the same size. If team size is as much a function of management style and resource availability as it is of project scope and required technical skill sets, it stands to reason that managers who add or remove staff from a project need to understand how using smaller vs. larger teams will impact cost and quality.
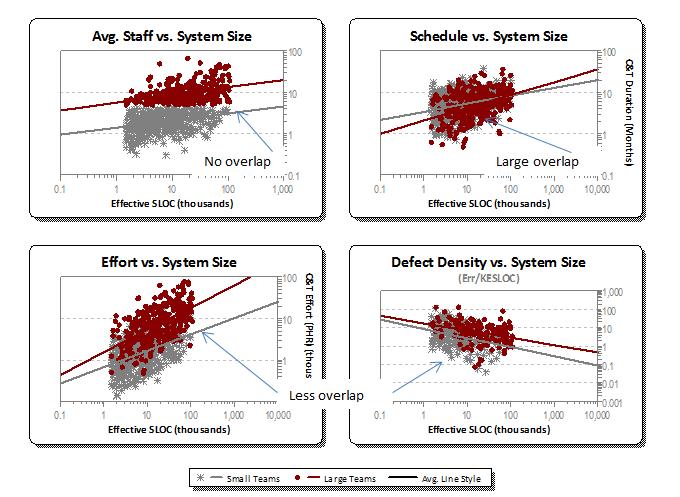
Regression trends were run through each sample to pinpoint the average Construct & Test effort, schedule, and quality at various points along the size axis. On small projects (5000 new and modified source lines of code), large teams achieved an average schedule reduction of 24% (slightly over a month). But this improved schedule performance was costly: project effort/cost tripled and defect density more than doubled.
Larger projects (50,000 new and modified source lines of code) using large teams managed delivered only 6% faster (about 12 days) but effort/cost quadrupled and defect density tripled. The tradeoffs between team size and schedule, effort, and quality are easily visible by inspection of the chart below. The schedule chart shows little difference between small and large teams (note the high degree of overlap between the two samples). But the effort and defect density charts show distinct differences (less overlap) between small and large team projects:

So what might account for these results? Over three decades of data from the QSM database suggest that defect creation and density are highly correlated with the number of people (and hence communication paths) present on a given project. Larger teams create more defects, which in turn beget additional rework. Fixed code must be retested and the team may find new defects injected during rework. These unplanned find/fix/retest cycles take additional time, drive up cost, and cancel out any schedule compression achieved by larger teams earlier in the lifecycle.
In the first post in this series, we saw that best in class software projects typically use smaller teams (four times smaller, on average) than poor performers. This post looked at the differences in cost and quality between small and large team projects. Larger teams realized modest schedule compression on small projects, but saw little or no improvement in time to market for larger projects. Regardless of project size, the large team strategy drastically increased cost and reduced quality. The last post in this series will examine the relationship between team size and productivity.
Read more QSM blog posts about team size.
