At a recent meeting of the Airlie Council of the US Department of Defense, Lawrence and Douglas Putnam were asked if the database maintained by Quantitative Software Management showed a decline in software-development productivity and software-product reliability comparable to the one found by Howard Rubin in his Worldwide Benchmark reports for the past two years. The short answer is yes!
Conventional productivity declines
Rubin found that conventional productivity (source lines of code per professional per year) declined 49 percent from 1994 to 1995 and another 19 percent from 1995 to 1996. The total drop over the two years was 59 percent.
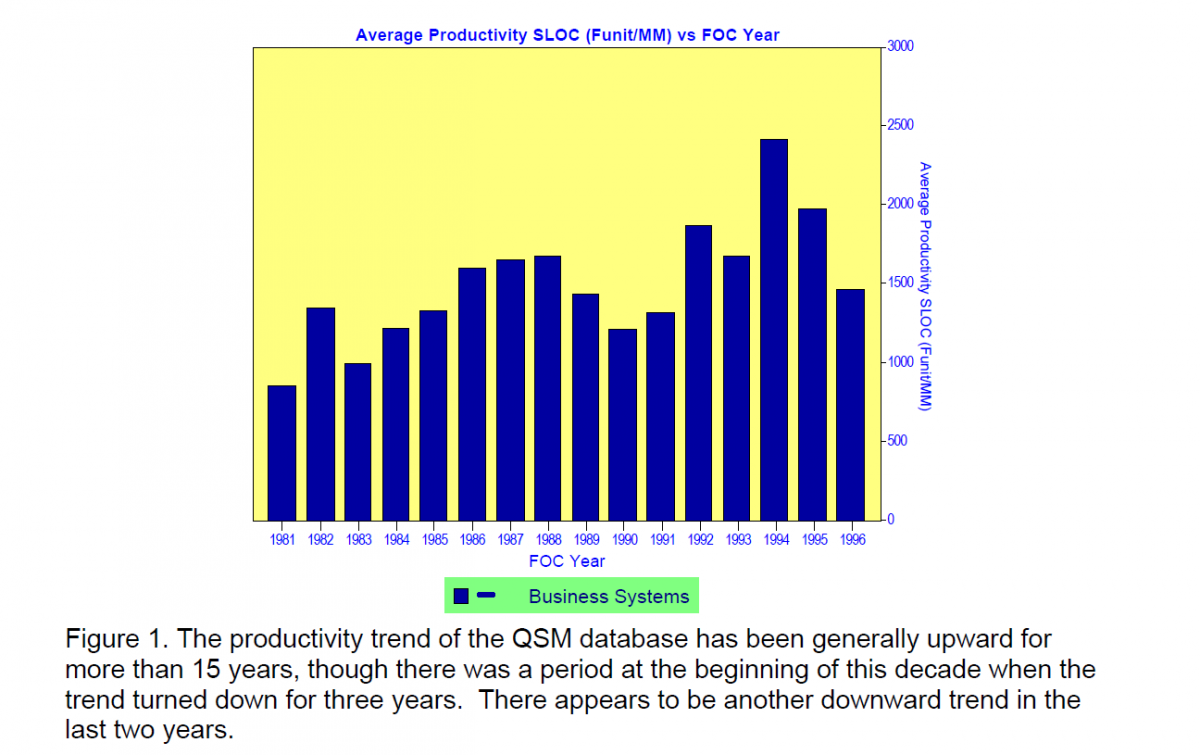
The QSM database shows that conventional productivity (source lines of code per person-month) of business systems fell 19 percent from 1994 to 1995 and another 26 percent from 1995 to 1996. The total drop over the two years was 40 percent.
The amount of these declines may seem rather far apart—59 percent vs 40 percent. The point is: they are substantial. They differ because they are derived from different samples collected in different ways. Rubin depends upon questionnaires returned by responding companies. Each company’s methods of defining and collecting data may be different. The returned questionnaires are a small sample of the entire world of software development. Since the questionnaires are returned voluntarily, they may not be entirely representative of the larger world.
QSM collects data by projects, rather than by companies. It maintains long-term relations with the contributors of project data and assesses the incoming data for common-sense validity before adding it to the database. However, QSM does not believe that the companies collecting and submitting project data are representative of the entire software development world. Most of that world, if we are to believe the findings of Capability Maturity Model assessments, does not keep data.
Nevertheless, the fact remains that both data-collection methods have shown increasing productivity for many years and now report two years of declining productivity. Figure 1 shows the QSM record in terms of source lines of code per person-month since 1981.
Process productivity also falls
Conventional productivity assumes, in effect, that software development is based on the following relationship:
Conventional Productivity = Size/Effort
However, this equation does not take into consideration the effect that the development time allowed has on software development. When we take this effect into the equation, we get: a different version of the relationship between the software-development metrics:
Process Productivity = Size/Effort1/3Time4/3
This relationship is still measuring some kind of productivity, but it is obviously different from conventional productivity. We have called it process productivity. We believe that this equation represents what goes on in software development more accurately than the first equation. Note that conventional productivity is a linear relationship, while process productivity is nonlinear. Nonlinearity better represents the complexities of software production. The schedule allowed for a project has a profound effect on the execution of the project, as the size of the exponent attached to the Time metric demonstrates.
The raw process-productivity numbers are very large, ranging up to 50,000 in our original studies. (Recently, some organizations have reached raw values of more than one million.) To make process productivity easier to work with, Larry decided to represent these large numbers by index numbers. In the computations carried out by QSM-SLIM, however, the raw values, which we call process productivity parameters, are employed. The original set of index numbers 20 years ago ran from 1 to 18, but now runs to 33 as organizations reached higher levels of process productivity.
For our present purposes, however, let us look at what has been happening to process productivity since 1981. See Figure 2. Represented as the process productivity index, (bar chart) it follows a generally upward progression. There is a slight fallback between 1988 and 1990, followed by a two-year rise. However, the last five years have been essentially flat, except for a peak in 1995.
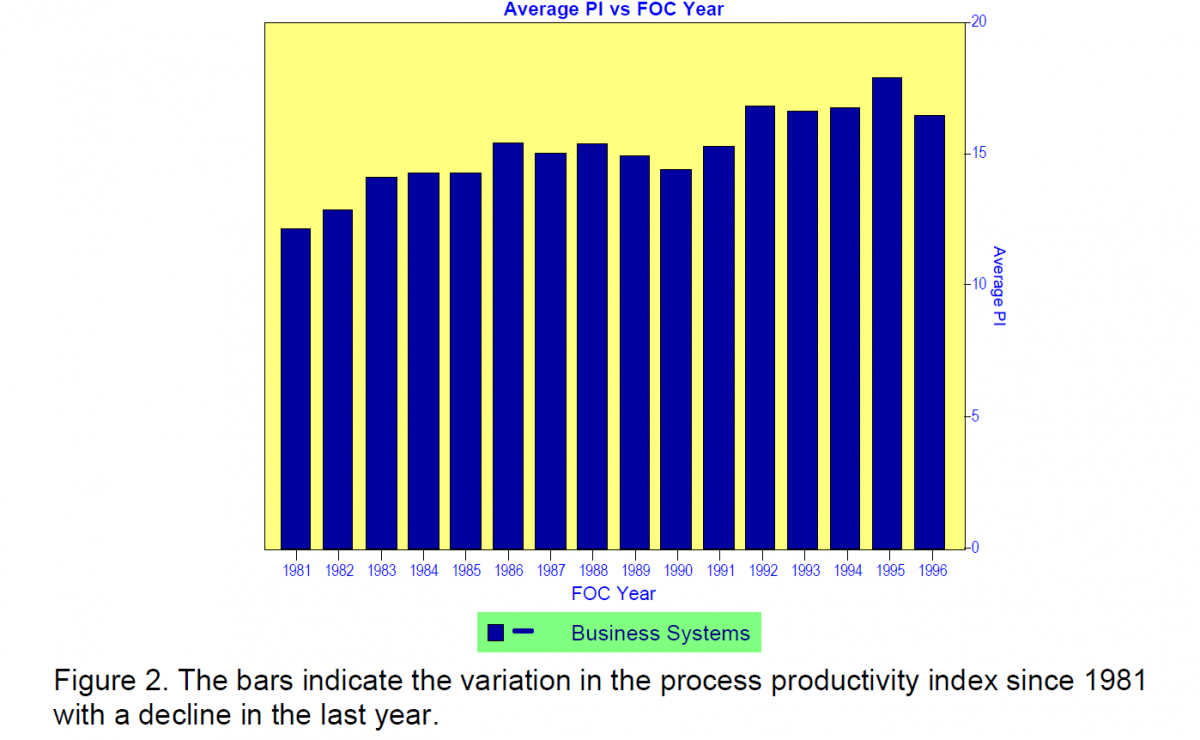
The process-productivity index numbers are themselves a linear representation, for convenience sake, of the actual process productivity parameter numbers, which are nonlinear. The index numbers show considerably less up-and-down effect than the conventional productivity numbers of Figure 1. When we plot the process productivity parameter it goes up and down the same as the index numbers, but the swings are much greater. For example, following the drop between 1988 and 1990, this parameter swings upward at a pronounced rate. The one-year decline from 1995 to 1996 represents a drop of 24 percent. That is not inconsiderable.
Thus, from the two surveys, plus the conventional-productivity and process-productivity interpretations of the QSM results, we get productivity declines ranging from 24 percent to 40 percent to 59 percent. We are justified in concluding that the drop in the last two years has been substantial, something on the order of one third.
Reliability declines
Rubin reported an increase in defects per KLOC prerelease of 16 percent and of defects per KLOC post-implementation of 126 percent for the year between 1996 and 1997, based on a small number of returns. Comparatively few companies keep defect data.
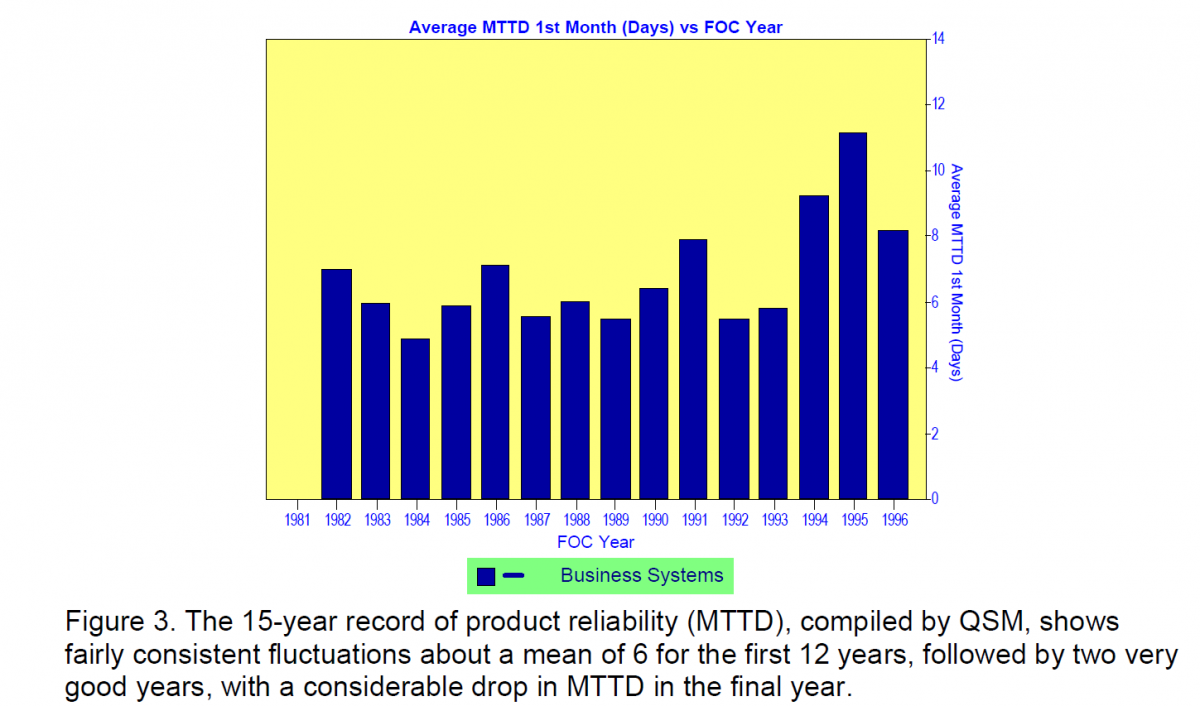
QSM expresses reliability in terms of Mean Time To Defect in the first month after release. The record since 1982 is depicted in Figure 3. In general, up until 1994, MTTD has been consistent, averaging about 6 days. The last three years, even including the final year 1996, have shown a substantial improvement, averaging about 9 days. There has been a decline of 27 percent in the final year.
Why the recent declines?
There are three sets of reasons for the declines in productivity and reliability. The first is that they are merely statistical variations from year to year. There have been down years in the past, soon followed by up years.
The second set of reasons revolves around events in the world in which software development takes place. An example of such a factor is the current staff shortage. If projects are short-handed or are employing marginal developers, productivity and reliability might well decline. However, we leave speculation about this set of reasons for another day.
The third set of reasons pertains to the statistical variables of software development itself.
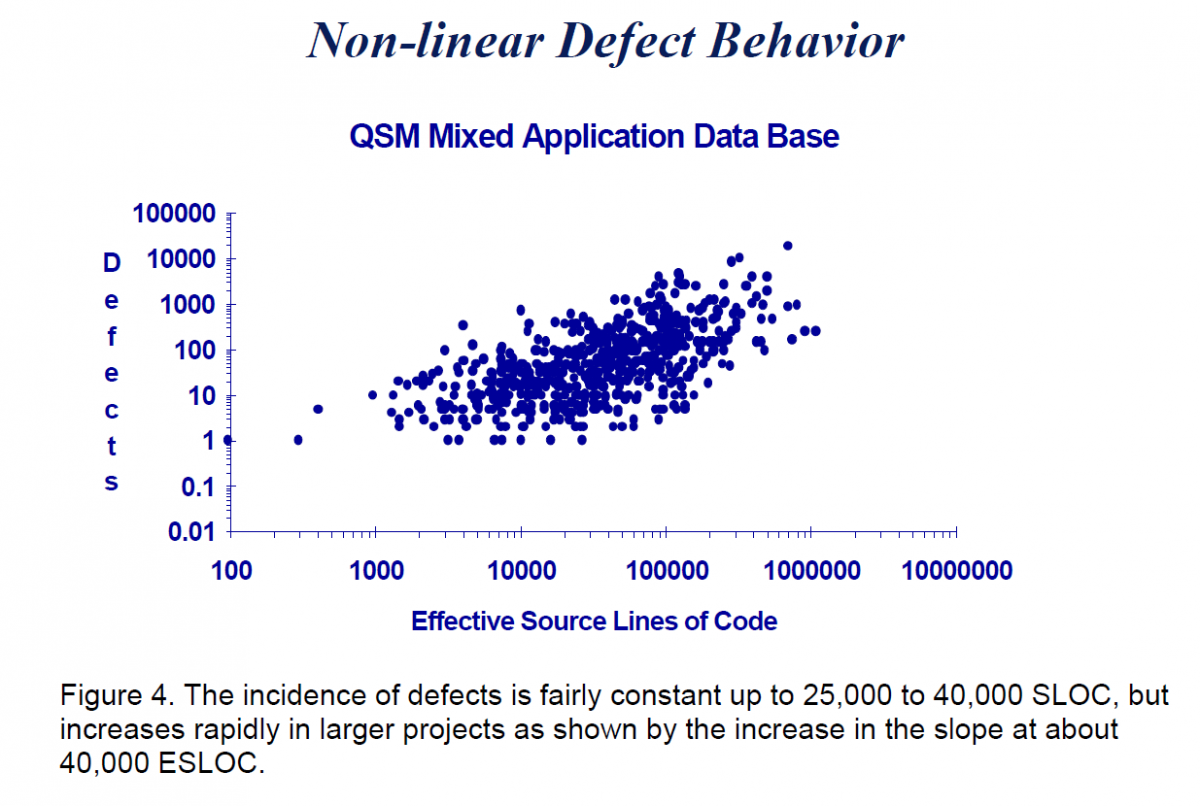
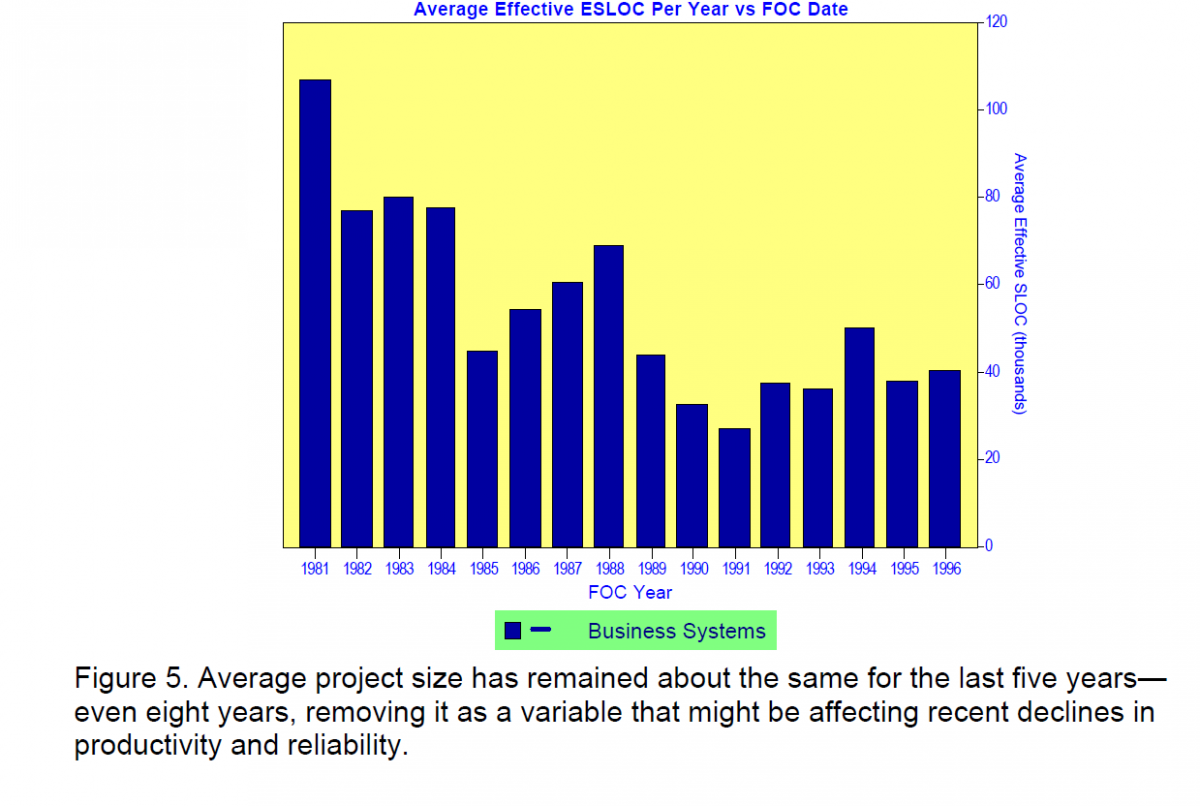
Project size. In general, product complexity increases with product size, leading to declines in productivity and reliability. Figure 4 demonstrates this statement with respect to reliability. The number of defects increases sharply at a project size of 25 to 40 KSLOC. Both scales on this figure are logarithmic; with linear scales the bend would be much more marked.
In the present case, however, the average project size has been declining since 1981, as shown by Figure 5. There has been little change in project size for the past five years. Project size does not appear to be a factor in the current declines.
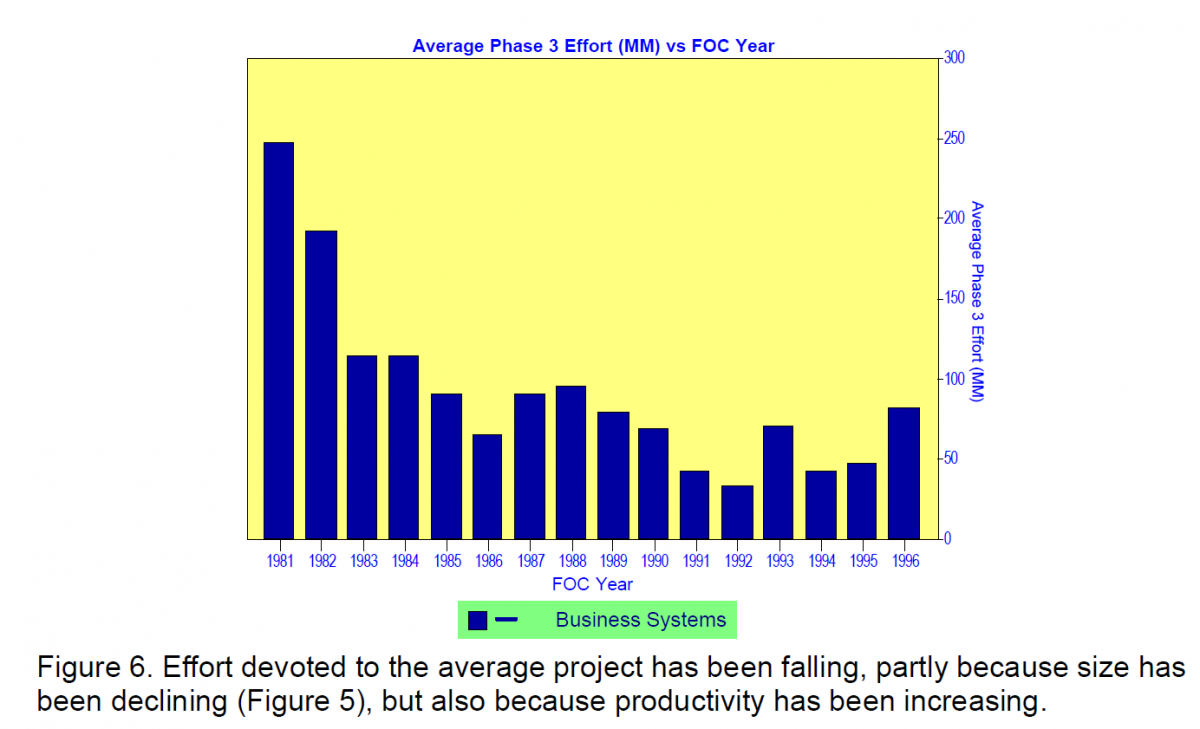
Effort. Figure 6 reveals that effort (person-months) consumed by the average project has been falling each year, with a few exceptions, for the last 16 years. Since effort is in the denominator of the two equations given above, falling effort would increase both conventional productivity and process productivity. In general, that is what has been happening over this time period. One possibility is that effort has declined because many of the contributors to the QSM database are taking advantage of our suggestion over the years to work with a smaller staff.
However, effort did jump substantially from 1995 to 1996, contributing to the recent decline in productivity. Of course, that leaves the question open: why has effort recently increased? That is probably an effect of the second set of reasons, which we are not exploring in this column.
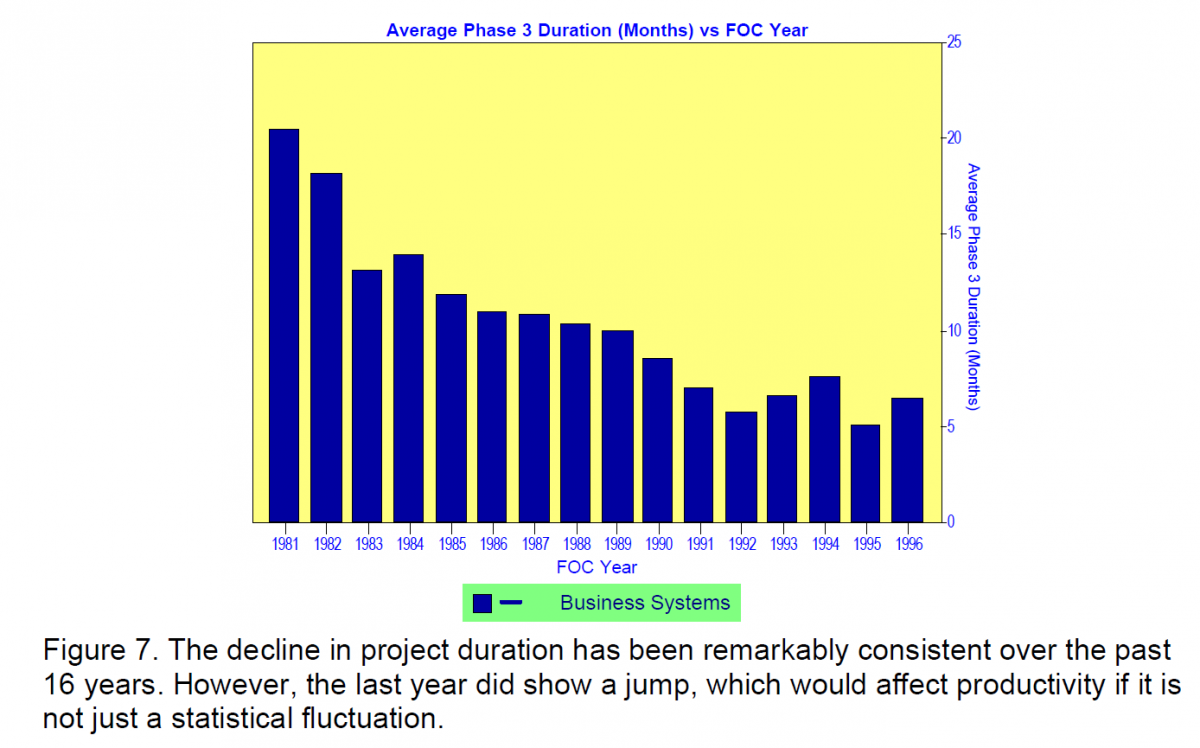
Development time. Project duration has also been declining over the period under observation, as shown in Figure 7. Again, this decline is partly attributable to the drop in project size and partly to the improvement in productivity. It may be that the astute folks contributing to the QSM database have been learning that they can do smaller systems faster and less expensively and that the resulting system is less error prone. The trends in schedule, effort, and MTTD appear to support this thought.
What you can do about it
One of the underlying purposes of our columns, as well as this newsletter in general, is to show how metrics can improve productivity and reliability. We can’t repeat all that we have written in this concluding note. Let us just say that the present column has been about averages. In real life organizations distribute themselves about these averages, roughly along a normal curve—the bellshaped curve of statistical theory. The statistical distance between a business-systems organization one standard deviation below the mean and an organization one standard deviation above the mean, measured in terms of process productivity, is a factor of 10. Getting across that gap is not easy, of course, but there are some organizations up there, proving that there is an “up” out there!