March 2013

March 2013

Haste Is Expensive

Large companies often seem to have a few people in key positions with extra time on their hands. Occasionally, this time is used to invent acronyms that are supposed to embody corporate ideals. Mercifully, these usually fade away in time. A former employer of mine had two beauties: LOCOPRO (Low Cost Provider) and BEGOR (Best Guaranteer of Results). Unfortunately, besides being grating on the ear, LOCOPRO and BEGOR don’t always march in tandem. LOCOPRO deals with cost and the effort required to deliver something. BEGOR is a bit more amorphous dealing with quality and an organization’s efficiency and consistency in meeting requirements.

What are the normal requirements for a software project? Here’s my short list.

  • Cost. What is being created and delivered has to be worth the expense in the mind of the person or organization that is funding it. (LOCOPRO is good)
  • Schedule. The timeframe in which a project creates and delivers its software is frequently a key constraint. Meeting this is important. Consistency and predictability (BEGOR are good)
  • Quality. In Business IT systems this is often an implicit requirement that is most noticed when it is absent. Real time, telecommunications, military, and life support systems are more frequently developed and tested to explicit quality standards.

The mantra of Faster/Better/Cheaper captures most organizations’ desires for Cost, Schedule, and Quality – all at the same time. If only the laws of software would cooperate! But they don’t. Software is like a balloon. You constrict it in one place (schedule, for instance) and it expands in another (cost). The problem isn’t going to disappear; but by prioritizing requirements, conscious and realistic tradeoffs can be made.

Blog Post Categories 
Schedule

Ditch the Madness: SLIM Your Brackets

Monday morning I received an email that read:

Hi All,
You can set your clocks to it: the birds flying north for spring, daylight savings time, and this email being sent on the Sunday before the tournament begins.  That's right, March Madness is upon us my friends, and we’ve officially made it through winter. 

The message continued with details about how to participate, but as you can see, it’s time for QSM’s annual March Madness tournament.  So how do I justify spending company time filling out brackets?  By blogging about how this is actually related to project management.  As I went through the exercise of predicting the course of this tournament, I realized that many of the thoughts I had also go through the minds of project managers.

Before I reveal my picks I want to give some background information.  I’m new to this whole March Madness tournament thing.  I’m not familiar with the teams.  I don’t know the players’ strengths and weaknesses.  I didn’t watch their games earlier in the season, so I don’t know their stats.  All I know is that my significant other went to Ohio State so I want them to win.

Blog Post Categories 
SLIM-Estimate Project Management

Velocity: What Is It?

It’s easy to get confused or overly concerned about measuring velocity. Actually, the concept is almost embarrassingly simple. Velocity in Agile is simply the number of units of work completed in a certain interval. Like in many fields, Agile proponents appropriated existing terminology.

Here is one typical definition, from agilesoftwaredevelopment.com:

In Scrum, Velocity is how much product backlog effort a team can handle in one Sprint. Velocity is usually measured in story points or ideal days per Sprint… This way, if the team delivered software for 30 story points in the last Sprint their Velocity is 30.

Velocity as a capacity planning tool used in Agile software development is calculated from the results of several completed sprints. This velocity is then used in planning future sprints.

The concept of velocity comes from physics. In physics, velocity is speed and direction, in other words, the rate of change of position of an object. Speed can be measured in many different ways.

In software, speed is frequently measured as size per unit of time (sometimes this has been called delivery rate). The measure of size could be any of the common size measures: lines of code, function points, requirements, changes, use cases, story points. The measure of time could be calendar time (month, week, day) or it could be specific to a project (sprint, release). As to direction, in software hopefully the direction is positive, but sometimes projects go backwards (for example, backing functionality out of a system).

Blog Post Categories 
Sizing Agile

What's the Story in Your Data?

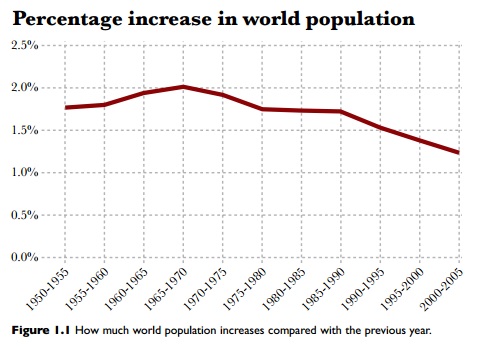
In his book, The Functional Art, Alberto Cairo sets out to explain what data visualizations are, why it is significant to pair data and design, and how to assess whether a data visualization is "good" or not.  In the first chapter, Cairo presents an example from Matt Ridley's book, The Rational Optimist: How Prosperity Evolves.  Ridley asserted that the global population was decreasing over time, using only one line chart.

Percentage Increase in World Population


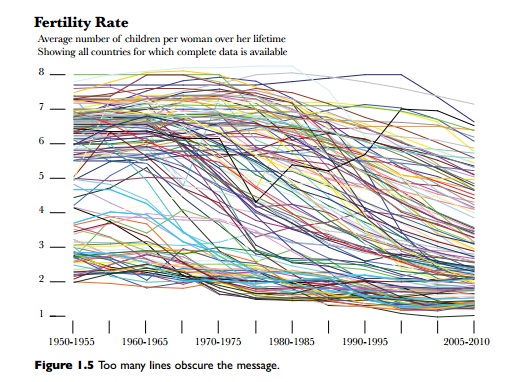
Cairo  was uncomfortable with that assertion, so he used the UN and World Bank data for fertility rates (the average number of children born to a women in each country) to create a graph that used individual country population data instead of using aggregate data.  The chart below shows all the fertility rates for every country over time.

Fertility Rate

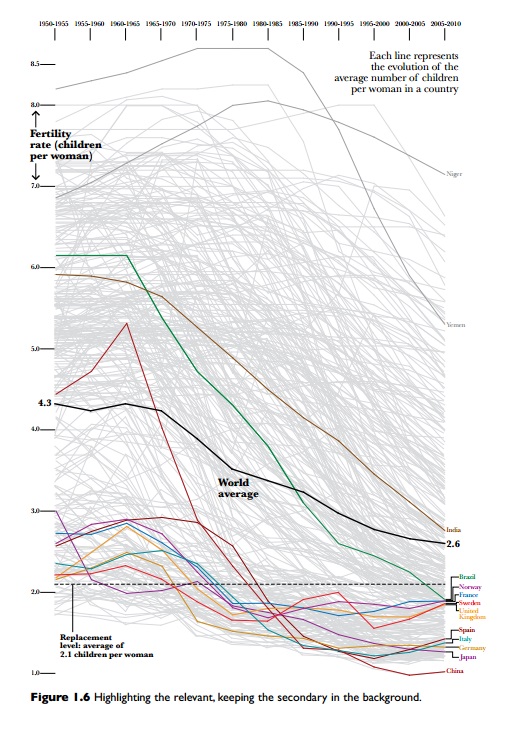
There are so many stories in the data that it's overwhelming, so Cairo created the following graphic which highlights just a few countries in order to pull out the story within the data:

Figure 1.6 Highlighting the relevant, keeping the secondary in the background

Blog Post Categories 
SLIM-Metrics Data