In the previous articles in this series I presented SLIM-Estimate’s use of uncertainty ranges for size and productivity to quantify project risk, and how to build an estimate that includes contingency amounts that cover your risk exposure. In this post I will identify the project work plan reports and charts that help you manage the contingency reserve. You will see how to use SLIM-Control bounds and default metrics to keep your project on track.
Understand the project work plan documents.
In our example so far, you have estimated a project to deliver a software product in 11.7 Months, with a budget of $988,223. This estimate includes an 80% contingency reserve, or risk buffer, on both effort and duration. Your work plan is based upon SLIM-Estimate’s 50% solution; 11 Months and $755,400. Thus, the uncertainty about size and productivity are accounted for; it is built into your plan. The probability that you will meet the project goals is driven by many factors ‒ too many to measure. You can only manage what is within your control, and escalate issues so they can be resolved in a timely manner.
Managing the project well begins with a solid understanding of the detailed project plan. SLIM-Estimate provides several default and customizable charts and reports that document the plan. Here are a few key reports1 to study in order to identify the core metrics you will want to monitor closely.
- Gantt Chart ‒ Graphical presentation of the project task time line with milestones overlaid. Provides insight into the relative size of major activities, overlap, and sequencing.
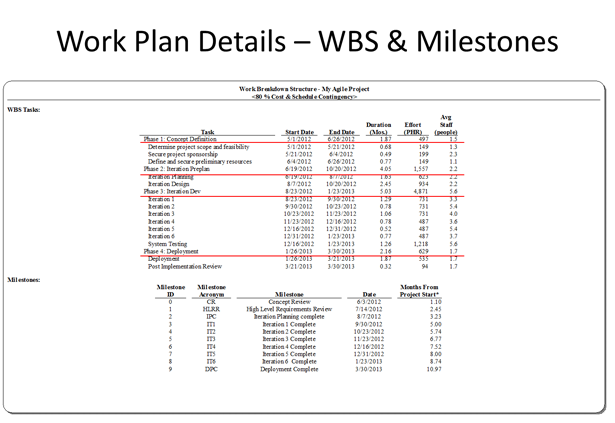
- WBS & Milestone Report ‒ Gantt chart data. Shows start and end dates, duration, effort, and avg. staff for phases and tasks. Milestones are listed with planned completion date and months from start, e.g., “Iteration 3 Complete; 6.77 Months from Project Start.”

- Effort Rate Report ‒ Person Hours (PHR) project for each month, for the entire life cycle, or by phase. The phase-level charts are particularly helpful in tracking effort as multiple activities are being performed in parallel.
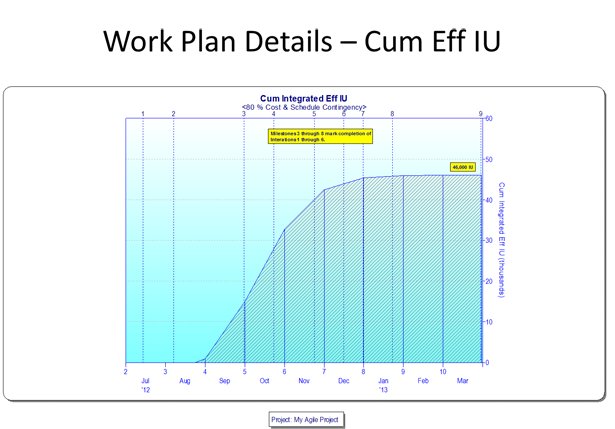
- Cumulative Integrated Effective IU Chart and Report ‒ Shows product development progress over time. Well-defined interim product completion milestones provide insight into the relative size of iteration builds. Iteration completion milestones 3 through 8 on the chart below lets you compute the percent code produced with each iteration.

Reviewing the detailed project plan will help you identify specific tasks and project junctures that will require extra management oversight. For example, the Cum Eff IU report shows that, although coding and testing span from late August to late January, the majority of functionality is produced in the first three of six iterations. Schedule delays during in those first iterations will be costly.
What can SLIM-Control track?
SLIM-Control allows you to track plan versus actual data for all of the metrics described above, plus unlimited custom metrics. Plan values for default metrics are set up when you import your SLIM-Estimate work, including the following:
- Phase Start and End Dates
- Milestone Dates
- Staffing, either Avg. Staff or Effort (Rate or Cum)
- Cum Effective Size
- Defects, by Category
You may want to track other metrics, such as the number of test cases successfully executed, the number of requirements completed each iteration, requirements changes, etc. Use what you know you don’t know to define custom metrics to guide metrics data collection and analysis efforts.
Using control bounds and other analysis tools
Getting back to the original question, “how does uncertainty expressed in SLIM-Estimate relate to control bounds in SLIM-Control?” I wrote in the first blog post that they are not directly related; uncertainty ranges, probability curves, and control bounds help you quantify and manage different project characteristics. Collecting and analyzing core metrics as the project progresses is the best way to know if you are going to meet the project goals, or if not, how much time and budge contingency you will use. Control bounds are simply a visual technique for identifying deviations from a reasonable range around your plan. What is acceptable and what is unacceptable? Only you can decide, based upon your analysis of the detailed work plan mentioned earlier.
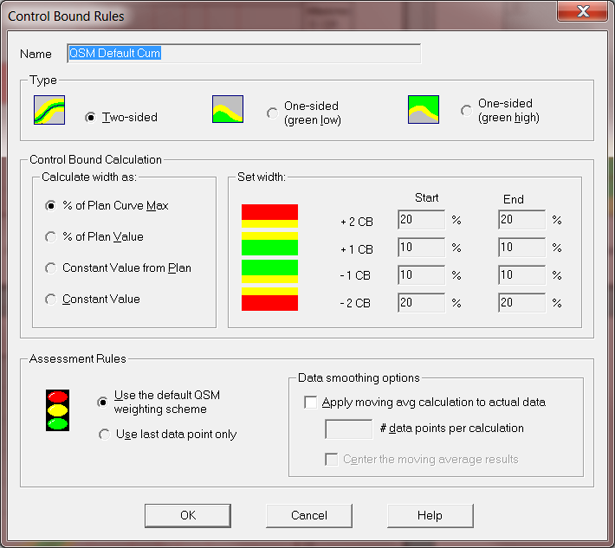
There are several options for configuring control bounds within SLIM-Control. The type of curve you select, whether two-sided, one-sided, or constant value, depends on the particular metric you are tracking. The most common metrics will be tracked as either rate or cumulative values over time. There are separate QSM default control bound settings for each. You can change the type and how the green, yellow, and red bounds are calculated.

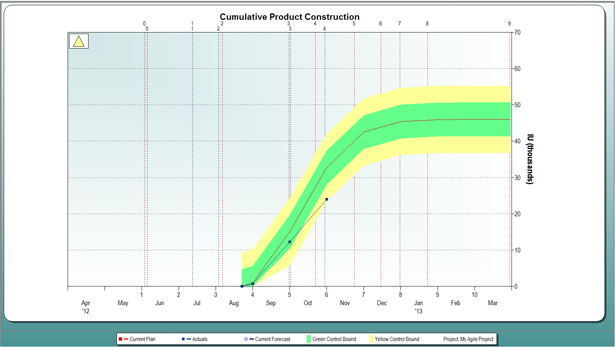
The chart below shows planned versus actual Cumulative Product Construction. At this stage in our sample project, product construction is behind schedule. The yellow assessment symbol in the top left corner, computed from the control bounds for this metric, indicates that some corrective action is needed. The assessment was green for three months prior. Should the control bounds have been configured differently to provide earlier warning? Well, the default for cumulative metrics is +/-10 of the Plan Curve Max on both sides of the plan curve. With Eff IU of 46,000, that translates to +/- 4600 IU deviation every month. You may want to narrow the range of acceptable deviations earlier in the phase, or change the type to % Plan Value. Perhaps a better option for this project would be to report actuals on a weekly rather monthly basis. That is more in line with Agile development schedule and practices.

Reviewing the control bound settings to ensure they match your risk tolerance will increase your trust in the assessment reports. You will be equipped to react in a timely matter, before the project veers too far off track. It will also keep you from over reacting to normal variations. Actual data will deviate from the plan. It is up to you set determine how much is acceptable.
Take advantage of the project snapshot feature and various assessment reports to get a bird’s-eye-view of project performance. Run forecasts to calculate estimates to complete when variations are significant. Reducing project risk and increasing your probability of success is directly tied to your metrics collection process, and what you do with the results. Not only will SLIM-Control help you effectively track and control the project, you will also have a rich set of completed project data upon which you base your next estimate. So, perhaps it turns out that the best risk buffer is you (“a person or thing that shields and protects against annoyance, harm, hostile forces, etc., or that lessens the impact of a shock or reversal”)! Just kidding, but good processes backed by good tools and well-defined reserve will increase your software development project success.
1 All SLIM charts can be toggled to reports. You can customize set the default setting for each view.
