“The only way to increase product quality and reduce cost while concurrently improving product development speed is to fundamentally change the development process itself.”
Christopher Meyer 1
“I’m going to spring four words on you,” Phil said, walking into John’s office. Phil was a software manager and John, one of his developers. “Faster time-to-market.”
John cringed in an exaggerated fashion, almost falling out of his swivel chair. Recovering his balance, he said, “And I’ll spit five words on you: Faster time-to-the graveyard.”
“Pretty good,” Phil said, “Your neuron network seems to be clicking. Put it to work on this problem: Competitors are getting to market ahead of us.” “They can’t keep it up,” John replied. “Their people will burn out.”
Unbeknownst to John some of them have been keeping it up.
Unbeknownst to Phil some of them seem to know how to do it.
We know one part of the answer: metrics. Our favorite four: size, schedule, effort, and process productivity, with an assist from the fifth, reliability.
In Figure 1 we bring our favorite four metrics together in one picture: Size-divided by-Process-Productivity on a field of logarithm of effort versus logarithm of schedule. This figure is a pictorial representation of the software equation:
(Project Size)/ (Process Productivity) = (Effort/Special Skills Factor) (1/3) (Development Time) (4/3)
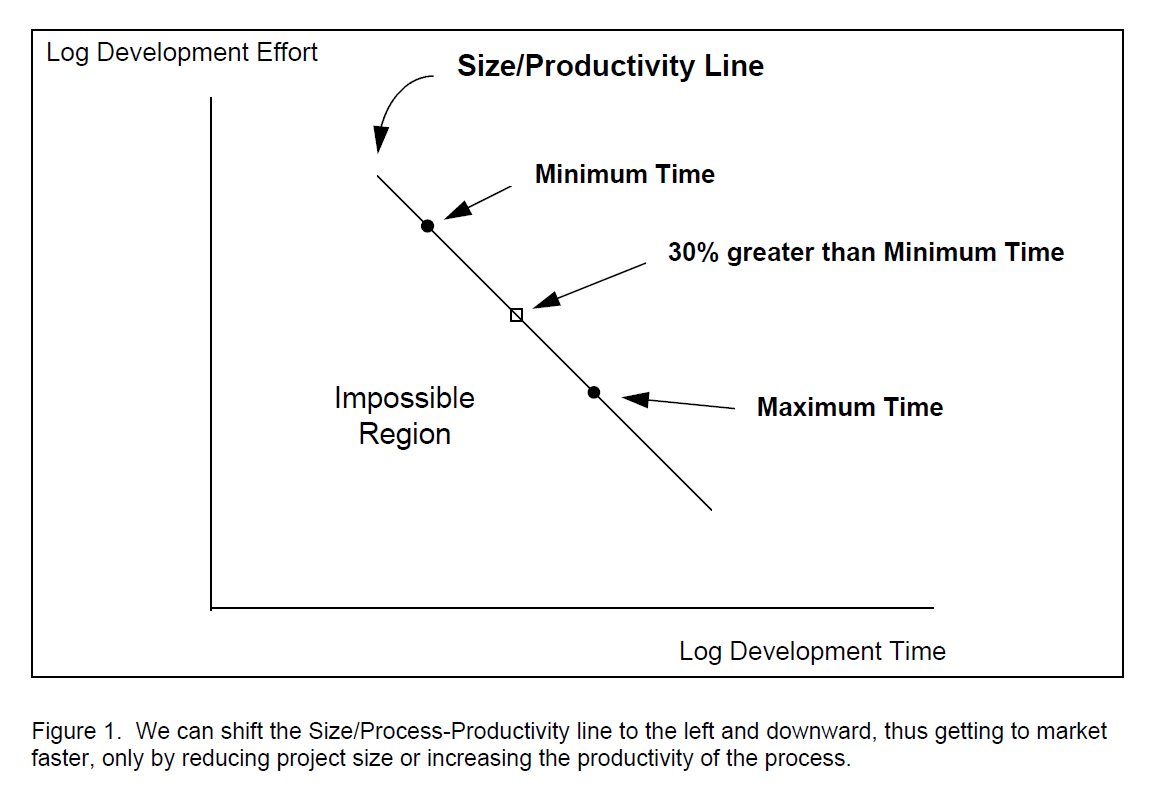
On a log-log field, the locations of time, effort points corresponding to the
Size/Productivity values fall on a straight line, (because of the exponential values in the software equation, which is a power function). On this line the upper dot represents the minimum development time; the area to the left of this dot is the Impossible Region, that is, no comparable project has ever been completed, according to our 4000-project database, at the values of schedule and effort found in this region.
We located the small square at about 130 percent of the minimum development time; generally developers find it impractical to extend development much beyond this point even though it is sometimes possible.
The values of effort and schedule between these two points fall in the project operating region, that is, the time and effort scale on which management can plan to execute the project. On the one hand, managers could seek to reduce development time by planning to operate the project closer to the upper dot. On the other hand, pushing the schedule time in this way leads to much higher costs.
If we take the size of the project and its process productivity to be fixed, at least in the short run, then we can get to market faster only at the expense of a considerably greater expenditure of effort, that is, cost. Moreover, the pressure of expending effort at a rapid rate results in more defects and lower reliability. The difference between schedule to the four/thirds power and effort to the one-third power means that shortening the schedule in this way is expensive, in fact, expensive by a factor of four.
Fortunately, we can turn to the two other factors in the software equation: size and process productivity. If we reduce the size of the project, the Size/Productivity line moves to the left and downward. The operating region now lies in an area of reduced schedule and reduced effort.
Similarly, if we increase process productivity, the line also moves to the left and downward, resulting in the same effect. In either case, we could get to market faster without increasing cost.
So, we have shown, mathematically, that we can achieve our objective of faster Time-To-Market in this way. Of course, two problems remain. How do we reduce size without sacrificing functionality? How do we increase process productivity? If solving these problems were easy, everyone would have done so long since. At least we know what we have to do.
Reduce size
That bald statement, “Reduce size,” is one way, but it lacks sophistication. At the beginning of an entirely new project, users often do not know in detail what they want. They need to find out, through working with something, what they need. This process is called iterative development. The developers give them a rapid prototype; they try it out in practice; they report back what is good about it and what more they need. They report fairly soon—in weeks or months, instead of years later when a complete product might be ready. Iterative development speeds up the getting of valid requirements.
One way to get a prototype fast is to gin it up largely from existing software components. The prototype developers need write only a small amount of connecting code and that doesn’t take long.
In fact, the developers can later, when they and users have solidified requirements, put the final product itself together from reusable components. In effect, this technique greatly reduces size. That is, the size of the product, measured in lines of source code, may still be large, but the number of lines of code that actually have to be developed from scratch is small. Consequently, the development time and effort required are small.
We estimate that, already, experienced developers take up to 25 percent of a design out of their back pockets. Organizations with some pretense of organized reuse are getting up to 50 percent. With still better organized reuse components, a few organizations are reaching 75 percent. The theoretical limit appears to be more than 90 percent. In effect, the amount of a project that has to be designed and coded from scratch can be reduced by factors of two, four, or even 10. If you can establish effective reuse in your organization, you can move the Size/Productivity line quite a bit to the left and downward.
That’s a big “if,” of course, but a few of our clients are doing it. Their metrics prove it.
Increase process productivity
The process-productivity term in the software equation embraces more facets of productivity than lines of code per person month, the conventional form of productivity. Because of the way it is derived from size, development time, and effort, it represents all the elements that contribute to the effectiveness of a software project organization. These elements include the ability and experience of the people; the ability of the managerial hierarchy to plan the work, organize the people, and support their morale; and the methods, tools, and computer equipment in use.
One important factor is the ability of the organization to learn, to move from an outdated paradigm to a new one that provides better performance. The “learning organization” has appeared as a concept, but is scarce in practice.
Moving from paradigm to paradigm, for example, from structured design to object-oriented design, or from design-from-scratch to reusable components, is difficult. The process-productivity metric, by itself, does not affect improvement, but it does measure improvement. That is half the battle. It tells you whether what you are attempting is actually working.
Reliability
Oh yes, our last metric: defects per month, or mean time to defect. Our database shows that reliability improves as process productivity increases. Moreover, reliability (and quality) improve as reuse increases. For people to reuse components voluntarily, they have to be good components. They have to work; they have to be reliable.
The secret of faster Time-To-Market boils down to iterative development, reuse of really good components, and improved process, plus measurement of the result. These are hardly “silver bullets” because they all take a lot of work. But they do work! All for now.
“What do you say to that, John?” Phil asked. “Let’s get started.”
- 1. Christopher Meyer, [italics] Fast Cycle Time: How to Align Purpose, Strategy, and Structure for Speed, [end italics] The Free Press, New York, 1993, 290 pp.