“That phrase, time boxing, has a fine manly ring to it,” the vice president said, grinning broadly. “I like it.”
“What does it mean to you,” we inquired.
“First you box in the development time you allow a project to have,” he answered.
“No more shilly-shallying around. You draw a box on the time line, like this (Figure 1). The project people know they have to deliver at the end of the box.”
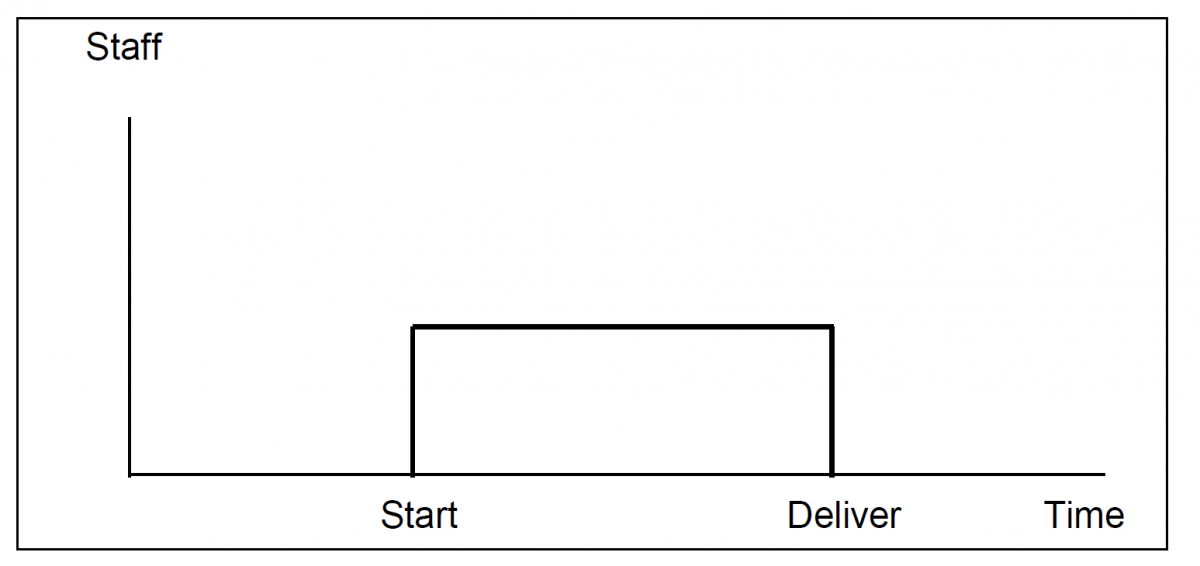
“That’s all there is to it?” we asked. “You draw a box and all those prima donnas get religion?”
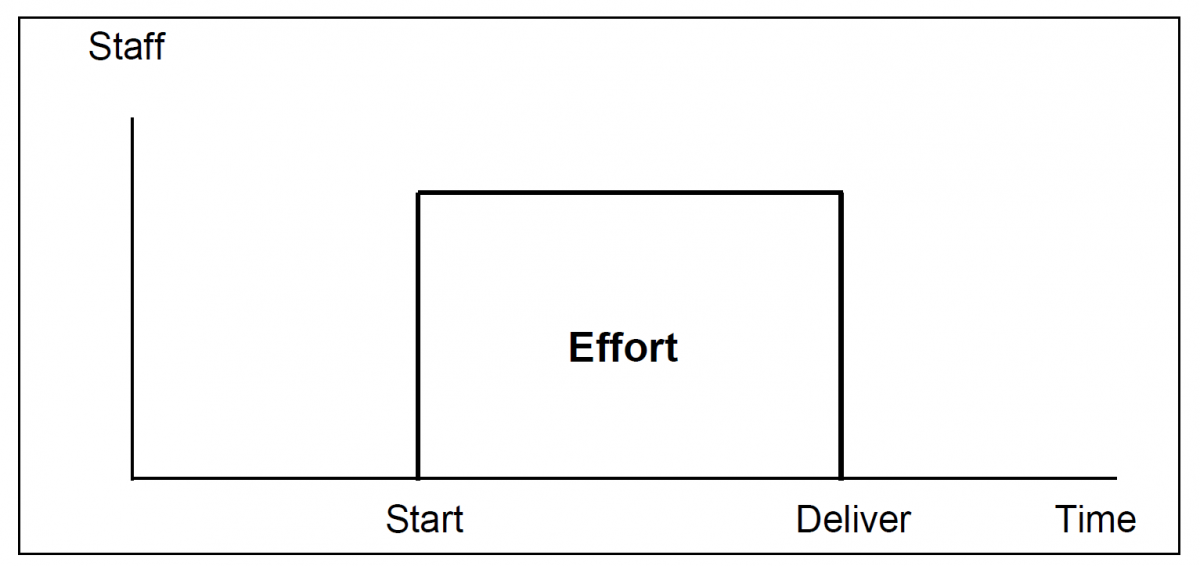
“No, there’s more to it,” he responded. “You have to set the height of the box, like this (Figure 2). The area in the box represents the staff months allowed for the work.
Staff months, of course, are proportional to project cost or budget.”
“It seems like a good idea,” we agreed. “Your people are clearly on notice with a budget and a delivery date.”
“Yes, you would think they would be happy, but they are bitching as usual,” the vice president said. “They don’t seem to appreciate that we have users who need the product at a date certain. They don’t seem to realize that we have a very limited amount of money to work with.”
“Professional people are sometimes like that,” we said. “Still, it does take a certain amount of time and effort to do a certain amount of professional work. How are you setting the height and length of the box?”
“We establish the delivery date mainly by what the user needs, but we do ask the project manager if he thinks he can meet the date,” he replied. “Same with the budget. We get what we can from the customer.”
“Yes, we live in a market-driven world,” we agreed. “Still, there is no gain in setting a delivery date and budget your project teams can’t meet.”
“That’s why we asked you to come in,” the vice president said. “We’ve heard you have formulas or tables or something that helps set these numbers.”
Yes, we have a software equation that shows the relation between the four management numbers: size, effort, time, and process productivity. These four numbers are related. You can’t set one without affecting the others.
Time boxing delivery date
In a situation like the vice president is faced with, one of the numbers, process productivity, is fixed. At least in the short run, he is pretty much stuck with what he has. If he then time boxes the delivery date, in other words, he fixes it, the other two numbers, effort or size, have to change. It’s like squeezing a balloon.
First, a warning. You can’t set any old time-box delivery date somebody wants. There is a minimum development time below which lies the Impossible Region. No organization reporting to our database has ever successfully completed a project in that region. You can time box a project between that minimum and about 130 percent of it, as diagrammed in Figure 3. Beyond 130 percent, you enter the Impractical Region. So, the time box has a restricted length.
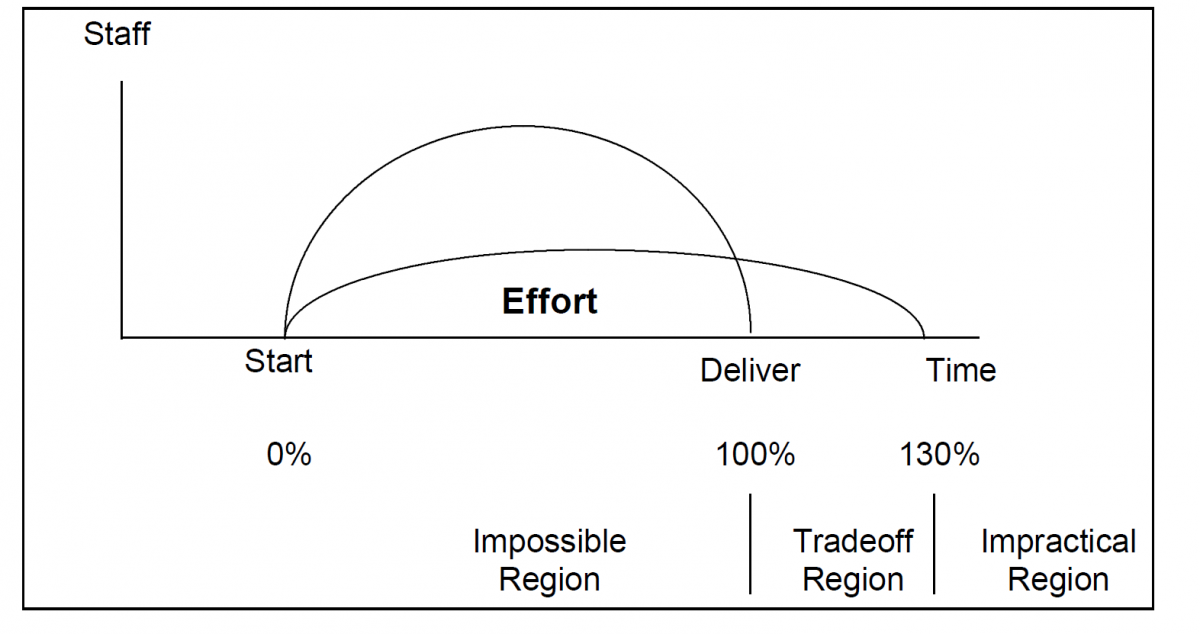
If you time box the development at the minimum time, the staff needed bulges upward. The effort (area under the curve) increases. If you allow more time, you need less staff and use fewer person-months. For example, let’s take a typical project: 75,000 SLOC (a size near the average of projects being reported to our database); process productivity index of 12 (a little more than one standard deviation below the mean of our business database, but near the average for other types of applications). Staff and effort are high at the minimum development time and decline as we plan more time, as shown in Table 1.

In this case, we have been considering two factors—project size and process productivity—to be fixed. The software equation looks like this:
Size/Process Productivity = Effort1/3 x Time4/3
As we increase the time allowed between the minimum and 130 percent, effort drops off rapidly. The reason for the rapidity of the decline is the four times factor between time to the four-thirds power and effort to the one-third power.
Varying size
Process productivity is fixed in the short run of a single project, but we often have some ability to decrease the size in order to fit within some predetermined time box. For instance, clients may be willing to forego features not widely used. They may be able to defer to a second release peripheral features.
“The ship-date fix is usually done in order to force people to come up with that essential 20 percent [of a product] that gives 80 percent of the benefit,” Chris Peters, vice president of the Office Product Unit at Microsoft, told Michael Cusumano and Richard Selby. “Remember, the problem is not lack of ideas; the problem is too many ideas.” 1
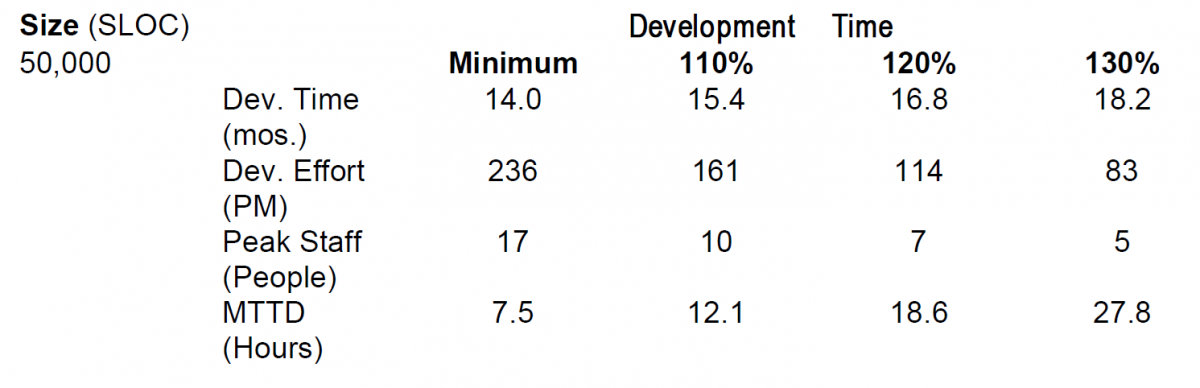
In the present case, suppose we want to run the project at the 130-percent time line in order to minimize effort and cost. That calls for planning a nearly 22-month schedule, as shown in Table 1. The customer is happy with that saving, but he sure would like to have an 18-month schedule. (We have noticed that people like round numbers, like a year and a half.)
Well, there is only one more variable to work with: size. In this case, with the fixed terms on the left, the software equation looks like this:
Process Productivity x Effort1/3 x Time4/3 = Size
Now, if we reduce Size (Process Productivity remaining constant), Effort and Time must decline. When we run the equation at 50,000 SLOC, we get the numbers listed in Table 2. We not only get the delivery date the customer wants, we get greatly reduced staff and effort and improved mean time to defect.
At first, time boxing sounds almost like a teen-ager’s computer game, but it makes a lot of sense. The box can’t be arbitrary, of course. The size of the project and your present process productivity set limits on the development time. The time-box period you select between Impossible and Impractical determines your effort or cost. Then, if you want a shorter time box, your only recourse is to cut features.
- 1. Michael A. Cusumano and Richard W. Selby, Microsoft Secrets, The Free Press, Simon & Schuster Inc. New York, 1995, 512 pp.