Yes! Do you want to be on the trailing edge of this paradigm shift while your competitors are using objects to consistently maneuver inside your development cycle.
John A. Strand III
No! Skeptics point to steep learning curves, dashed hopes, and compatibility problems. . . . For every object-oriented programming success story you’ve read, there are 50 failures shoved under the computer room floor. Martin A. Goetz 1
A little debate gives a nice fillip to the consideration of a technology. Without some numbers, however, what is a manager to do? Participants on all sides always sound sincere. Fact is, they are; they have had a good (or a bad) experience with the technology at issue. Or, they are beating the drum for their technology. Or, they are a competitor, trying to beat it into the ground.
Answer: metrics! You probably had already guessed it. There are a couple of provisos. Enough companies to make a decent sample have to be keeping the same metrics. You must have a technique to make a productivity metric that can be compared from those measures.
Those “familiar metrics—“schedule time, effort, size, and defect rate—are kept by many companies, not all, but by enough to make a statistical sample. Our process productivity metric meets the second proviso. We described it in the first set of columns in this newsletter last October, but we’ll jog your memory in the footnote2. The point of importance is that process productivity incorporates the three main variables, size, effort, and time, involved in the accomplishment of a software project. In consequence, it reflects the effectiveness with which all the factors involved work—supervision, people, and process.
In recent columns we have already used these familiar metrics and the resulting process productivity number as a gauge of process improvement within an organization. In most of these cases many improvement efforts were under way and we had no way to establish that a particular technology was the principal factor at work. About two years ago, however, Netron, Inc. of Toronto provided this opportunity.
The technology
First, a word about Netron. It has been in business since 1981. Its business is frame technology, developed by Paul G. Bassett, beginning in 1978. More than 150 organizations now use frame technology.
Now, what is frame technology? Among other things, it is a form of reuse.
Experience shows that reuse is not easy to implement. In his new book Ed Yourdon estimates that “passive reuse. . . typically hovers at the 10-15 percent level in most IT organizations today.” With what Yourdon calls “aggressive reuse,” organizations can reach 50, 60, or even 80-percent levels of reuse. 3 Frame technology is, among other things, an “aggressive reuse” technology.
A frame is an adaptable building block. That is, it contains instructions for converting generic functions and data structures contained in the frame or other frames into source code ready to be compiled. The instructions are executed by a frame processor, a precompiler working at what Bassett calls “construction time.” He contrasts it to “run time,” which, in the case of object-oriented programming, comes after all the reusable objects have been inherited through message passing. Unlike object-oriented technology, frames can work with any language; and they avoid the complexities that come with having many thousands of classes. Only a few hundred frames will do the same job.
Frames may be vendor-supplied or developed in house as corporate-or division-wide standard components. That is where the reuse comes in. With vendor-supplied frames alone, an organization developing business systems can reach 70-percent reuse. As it develops its own corporate and division frames, it gets into the 80 and 90-percent reuse range. Bassett tells the whole story in his new book. 4 Obvious point: this technology seems to be hot. Further obvious point: Netron is a vendor.
Vendors believe in their technology. Potential users know that. Then what?
The answer (again): metrics
Netron arranged for nine of its customers to supply metric data on 15 projects confidentially to Ira Grossman and Michael C. Mah, operating as QSM Associates in Pittsfield, Massachusetts. Some of these users everyone has heard of: Ameritech, Chemical Bank, Hudson’s Bay Co., Revenue Canada.
All the projects were in the business-applications category.
Size. The 15 projects ranged from 4574 to 9,300,715 source lines of code (without blanks and comments).
Time. Main build development time (including detailed design through user acceptance) was 1.5 months for the smallest project to 25.5 months for the largest. Effort. Staff months ranged from 2.1 to 1737.
Process productivity. The QSM process productivity index came out as follows:
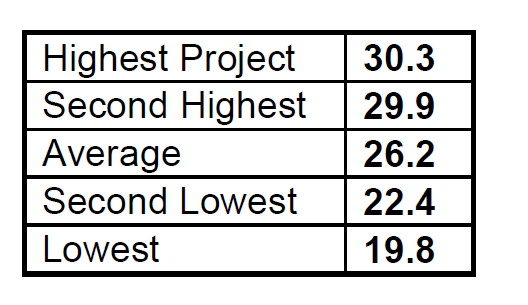
The productivity indexes of all the sample projects substantially exceeded the mean PI of the 2800 business projects in the QSM database: 16.9. In fact, all but the lowest project are better than one standard deviation (4.9 index points) above the mean PI of the database. Plus one standard deviation lies at the 84th percentile, meaning that these projects lie in the upper reaches of software-dom, as diagrammed in Figure 1. Better yet, 47 percent of the 15-project sample exceeds two standard deviations (95th percentile).
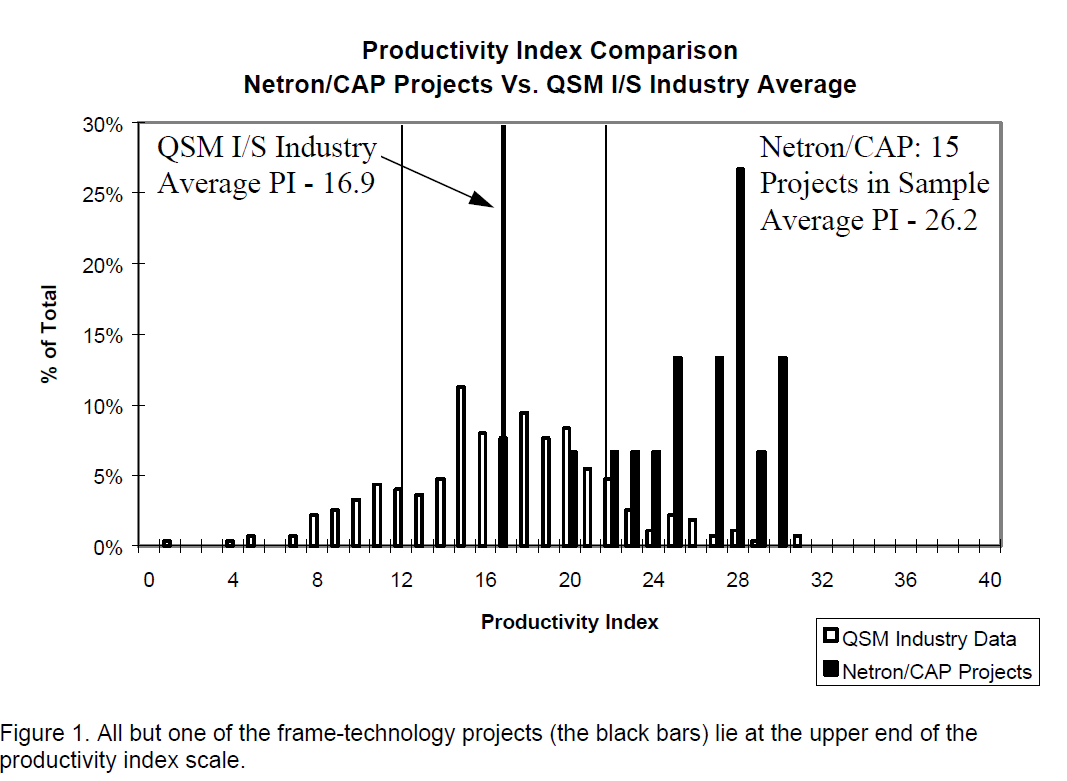
To put the comparison in different terms, the average PI of the sample (26.2) is 9.3 PI points above the QSM mean. Moreover, the PI scale is not linear in terms of its underlying process productivity parameter; each process productivity number is 1.272 times the previous process productivity number. Therefore, a PI of 26.2 is 1.272^9.3 times better than the average project in the database. That multiplies out to 9.4 times better. That is indeed “aggressive.”
Familiar metrics. What does this PI number mean in the conventional terms of time and effort? It means that a PI of 26.2 is better than a PI of 16.9 by:
70 percent shorter schedule
84 percent less effort (or equivalent cost)5
Hmmm. Very aggressive!
Reliability. Seven of the 15 projects reported a count of defects found in test. Six of the seven had fewer defects than the average number of defects comparable projects usually find in test.
Four of the larger projects (200,000 to 1.5 million source lines of code) reported figures for mean time to failure during the first month after delivery. Two of these figures were better than average; two were worse.
Code production. Thirteen of the 15 projects achieved SLOC/PM (source lines of code per person month) ratios in the top 20 percent of the QSM database. The SLOC/PM ratio has been used conventionally as a stand-in for productivity. This achievement is welcome, of course, but when Grossman and Mah graphed this code-production data, the dispersion of the data points emphasized its great volatility, or unpredictability. The two reiterated the QSM recommendation that code production rates “not be used for planning purposes.”
The bottom lines
The familiar metrics, time and effort, and the derived metric, process productivity, indicate that frame technology represents a very aggressive application of software reuse. Well, that pleased Netron and may encourage other companies to consider frame technology. That is one bottom line.
The other bottom line can be put in reverse. Vendors or users can apply familiar metrics to the evaluation of existing technology or new technology. Thus assured, users can probe fields new to them with enhanced confidence.
- 1. John A. Strand III and Martin A. Goetz, “Is OOP right for enterprise IS?” Computerworld, March 25, 1996, pp. 101-102.
- 2. Process Productivity = SLOC / (Effort/Special Skills Factor) 1/3 .Schedule 4/3
- 3. Edward Yourdon, The Rise and Resurrection of the American Programmer, Prentice Hall, Inc. Upper Saddle River, NJ, 1996, 318 pp.
- 4. Paul B. Bassett, Framing Software Reuse: Lessons from the Real World Yourdon Press computing series, Prentice Hall, Inc. Upper Saddle River, NJ, to be published July 10, 1996.
- 5. These familiar metrics were computed for the 13 smaller projects in the 15-project study. The two largest projects -- at 9,300,715 and 1,576,891 SLOC -- were omitted as unrepresentative of typical projects.