SLIM AI Delivers Fast & Accurate Software Cost Estimates

AI Encompasses More Than Just Generative
Artificial Intelligence
  • Computers mimicking human problem-solving
  • Broad scientific field
  • Multiple specialized approaches
Three Key AI Specialties
  • Machine Learning Systems improving through experience
  • Expert Systems Programs emulating domain expertise
  • Generative AI Creates content from training data
Artificial Intelligence is a broad scientific field focused on leveraging computers to mimic human problem-solving capabilities. While generative AI dominates headlines today, it's just one of three key AI specialties that drive business value:
  • Machine Learning systems improve through experience without explicit programming, analyzing patterns to make increasingly accurate predictions.
  • Expert Systems emulate human expertise in specific domains, applying rules and knowledge to solve complex problems.
  • Generative AI creates new content based on patterns in training data, which is useful but only scratches the surface of AI's potential in software estimation.
Understanding these distinctions helps us see how SLIM's AI capabilities go far beyond simple language models to deliver truly valuable estimation insights.
Estimation Accuracy Drives ​Trust And Alignment​
23%
Reduction in budget overruns
50%
Staff Reduction
14%
Faster delivery schedules
The impact of accurate software cost estimation extends far beyond just hitting budget targets – it fundamentally transforms how your organization operates. AI-powered estimation tools reduce budget overruns by 23% through more precise initial projections, risk avoidance, and continuous calibration throughout the software development lifecycle. Organizations using these enhanced tools save millions of dollars by reducing team sizes with minimal schedule penalty. Machine learning achieves this by analyzing patterns across thousands of similar software projects, providing insights that allow your team to identify optimal development approaches. Perhaps most importantly, stakeholders develop greater trust in IT departments that consistently deliver within projected parameters, strengthening cross-functional relationships.
The QSM Advantage Spans Four Decades
Software estimation requires both human expertise and sophisticated analytical tools working in concert to deliver reliable projections. QSM brings 47+ years of history and unmatched depth in software intelligence to this challenge, evolving our approach through thousands of real-world projects. Our machine learning capabilities analyze patterns across these projects to provide your team with defensible estimates that strengthen stakeholder trust and improve cross-functional relationships.
Photo of Larry Putnam, Sr., founder of Quantitative Software Management
Founded in 1978
Larry Putnam, Sr.​
Army Computer Systems Command​
Software Lifecycle Model
Four Decades Of Software Intelligence Evolution
14,400+ Completed software projects
Trusted by Leaders
  • Fortune 1000 companies​
  • Government agencies​
  • 47+ years of proven results
QSM was founded in 1978 by Larry Putnam, Sr. at the Army Computer Systems Command, where he began developing mathematical models to predict software project outcomes. His breakthrough came with the Software Lifecycle Model, which established the fundamental relationships between size, productivity, time, and effort in software development. This model enables managers to simulate different scenarios and make better business decisions about their software projects before committing resources. Fortune 1000 companies and governments worldwide have relied on SLIM for over 47 years to guide their most critical software investments. Our industry database has grown to over 14,400, providing an unmatched foundation for pattern recognition and machine learning.
SLIM Answers Your Most Critical Questions
Can we do it?
  • Feasibility assessment
  • Confidence levels
How much will it cost?
  • Budget Forecasting
  • Cost Ranges
What's the risk?
  • Probability modeling
  • Uncertainty analysis
How long will it take?
  • Schedule Prediction
  • Timeline modeling
How many people?
  • Resource planning
  • Team optimization
What are the tradeoffs?
  • Scenario comparison
  • Decision Support
QSM uses analytics and modeling to predict software project outcomes with remarkable accuracy, addressing the questions that keep you up at night:
  • When stakeholders ask "Can we do it?" SLIM provides feasibility assessments based on historical data from similar projects, giving you confidence in your answers.
  • For schedule predictions, SLIM answers "How long will it take?" with data-driven timelines that account for your specific constraints and requirements.
  • Budget forecasting answers "How much will it cost?" with ranges that reflect different confidence levels, helping you set appropriate contingencies.
  • Resource planning addresses "How many people do we need?" by modeling optimal team sizes and compositions based on your timeline and budget constraints.
  • Risk assessment answers "What's the risk?" through probability modeling that quantifies the likelihood of different outcomes.
  • And for the inevitable tradeoff discussions, SLIM helps you answer "What are the tradeoffs?" by comparing different scenarios side-by-side.
Machine Learning Powers Predictive Accuracy
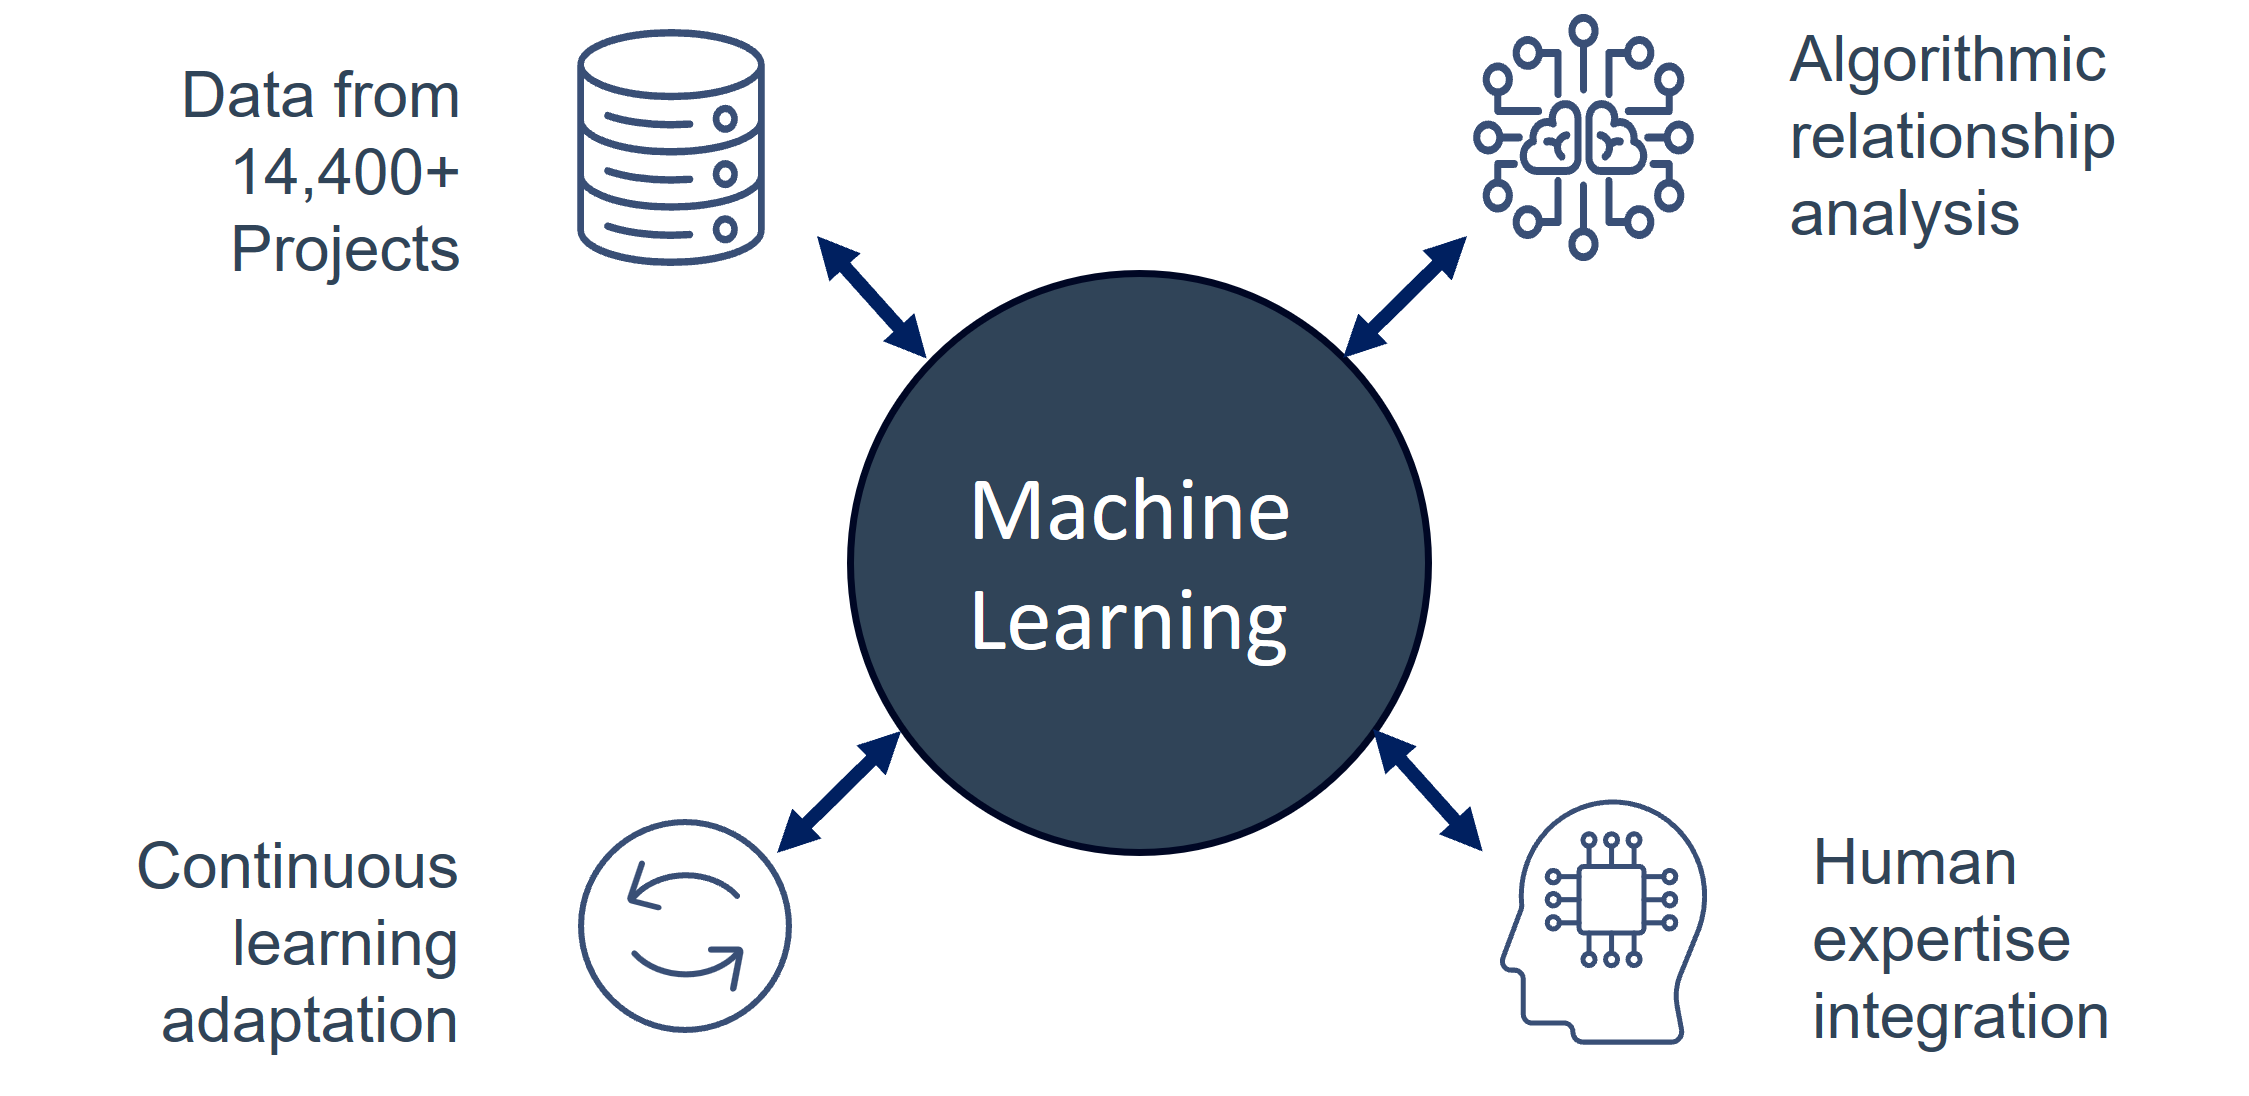
Diagram of circle with "Machine Learning" label and four spokes with associated icons representing very large software project database, algorithmic relationship analysis, continuous learning adaptation, and human expertise integration
Beyond Simple AI
  • Identifies non-intuitive patterns
  • Reveals complex metric relationships
  • Adapts to new project data
  • Combines algorithms with expertise
SLIM employs sophisticated machine learning and expert systems that go far beyond simple AI applications you might be familiar with. Our system learns from data across 14,400+ completed software projects, identifying patterns that would be impossible for humans to detect manually. The algorithmic analysis reveals complex relationships between metrics like team size, productivity, quality, and schedule – relationships that aren't linear or intuitive. Unlike static models, SLIM adapts through continuous database updates, incorporating new project data to refine its predictions over time. Human expertise is integrated throughout the process, providing context-aware insights that pure algorithms might miss. Many projects estimated with SLIM have less than a 10% variance between estimates and actuals, directly translating to more reliable budgets and timelines for your organization.
AI Transforms Complex Estimation Into Clarity
Software estimation complexity often leads to inaccurate projections, creating a cascade of problems throughout the development lifecycle. SLIM's AI-powered tools simplify this estimation process while simultaneously improving accuracy – a combination that was impossible before machine learning. By analyzing patterns across thousands of similar projects, these tools provide insights that allow your team to identify optimal software development approaches and communicate them effectively to stakeholders.
Software Equation Models Real World Dynamics
The Software Equation
Size = Effort 1/3 * Time 4/3 * Productivity
  • Empirically derived from data
  • Captures nonlinear relationships
  • Models interconnected factors
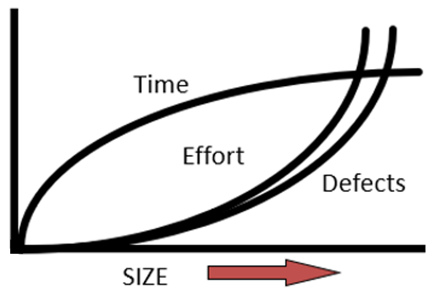
Plot of software size on the x-axis versus three curves for key outcomes, time (concave down, increasing), effort (concave up, increasing), and defects (concave up, increasing)

Small increases in project size can cause disproportionate increases in effort and time

At the heart of SLIM is the Software Equation: Size = Effort^(1/3) * Time^(4/3) * Productivity – a formula that captures the nonlinear relationships in software development. This equation wasn't theoretically derived – it emerged empirically from analyzing thousands of completed software projects across industries and technologies. It demonstrates how delivered value depends on interconnected factors that can't be manipulated independently without consequences. Most importantly, it shows how Time, Effort, and Defects change nonlinearly with software size – a reality that traditional software development estimation methods often miss. Understanding these relationships gives you a powerful advantage in negotiations, allowing you to show stakeholders the real-world implications of their requirements and constraints.
Negotiation Becomes Data Driven Not Opinion
 
Fixed Budget
  • Smaller team, longer time
  • Descope to fit budget
 
Fixed Duration
  • Larger team, compressed time
  • Descope to fit time
 
Fixed Scope
  • Negotiate required schedule
  • Negotiate required budget
The Software Equation transforms stakeholder negotiations from subjective opinions to data-driven discussions about what's actually possible. When facing fixed budget constraints, SLIM helps you explore tradeoffs like using a smaller team over a longer timeframe, or descoping features to fit within financial limitations. For fixed duration scenarios, you can model the implications of larger teams working in compressed timeframes, or again, descoping to fit both budget and schedule constraints. When scope is fixed, SLIM provides the data you need to negotiate the required schedule and budget based on historical performance of similar projects.
This approach shifts conversations from "I think" to "The data shows," giving you more credibility and influence in critical planning discussions.
Five Estimation Strategies for Every Scenario
Balanced Risk
  • Based on historical averages
  • Similar project trends
Rough Order of Magnitude
  • Quick baseline estimate
  • Refine as details emerge
Time Boxed, Fixed Team
  • Functionality possible given constraints
Fixed Resources
  • Functionality possible with specified effort
Bid Evaluation
  • Productivity needed for time and staffing
Flexible approach for any project context
SLIM's Solution Wizards provide flexible approaches to estimation that adapt to your specific information and constraints:
  • The Rough Order of Magnitude wizard gives you a quick baseline estimate that can be refined later as more information becomes available.
  • For balanced risk assessments, SLIM creates baseline estimates based on effort and time averages from historical trends of similar projects.
  • When resources are fixed, the Fixed Resources wizard calculates the amount of functionality possible with your specified effort level.
  • The Bid Evaluation wizard helps you assess vendor proposals by calculating the productivity needed to deliver within specified time and staffing constraints.
  • And for agile teams, the Time Boxed, Fixed Team wizard determines how much functionality is possible given your time, staffing, and productivity parameters.
T Shirt Sizing Makes Estimation Intuitive
 
Intuitive Sizing
  • Requirements
  • Capabilities
  • Features
  • Epics
  • Stories
  • SLOC and more
line with movable position to select software size ranges of very small to very large based on statistical trends from industry or custom data
Trend Groups
  • Real Time Group
  • Engineering Group
  • Scientific
  • System Software
  • Command & Control
  • Telecommunications
  • Scientific
  • Business (Agile, Financial, Gov’t)
  • Package Implementation
  • Cloud Migration
 
Huge reduction in estimation time
Combines simplicity with statistical rigor
When you have limited information about the software project scope, SLIM's T-shirt sizing approach makes estimation intuitive and accessible. Simply use the familiar XS, S, M, L, XL, XXL sizing based on industry trend groups to quickly assess project complexity. This approach leverages statistical ranges from QSM software trends across application types, development methods, and industries, including Engineering, Financial, Government, Agile, and Cloud Migration trend groups. The beauty of this method is that it combines simplicity with statistical rigor – behind the intuitive sizing is sophisticated analysis of similar software projects. This approach reduces initial estimation time from weeks to hours, while maintaining accuracy, allowing you to establish realistic expectations with stakeholders quickly.
Risk Assessment Becomes Automatic And Visual
Software projects face inherent uncertainties in scope, size, and productivity that can derail even the most carefully planned initiatives. SLIM's AI-powered risk assessment provides early warning of potential issues, allowing you to address them before they impact your project. By identifying patterns from thousands of similar projects, the system can predict where problems are likely to occur and suggest mitigation strategies based on what has worked in similar situations.
Compare Your Project Against Industry Benchmarks
Project Risk Assessment Dashboard
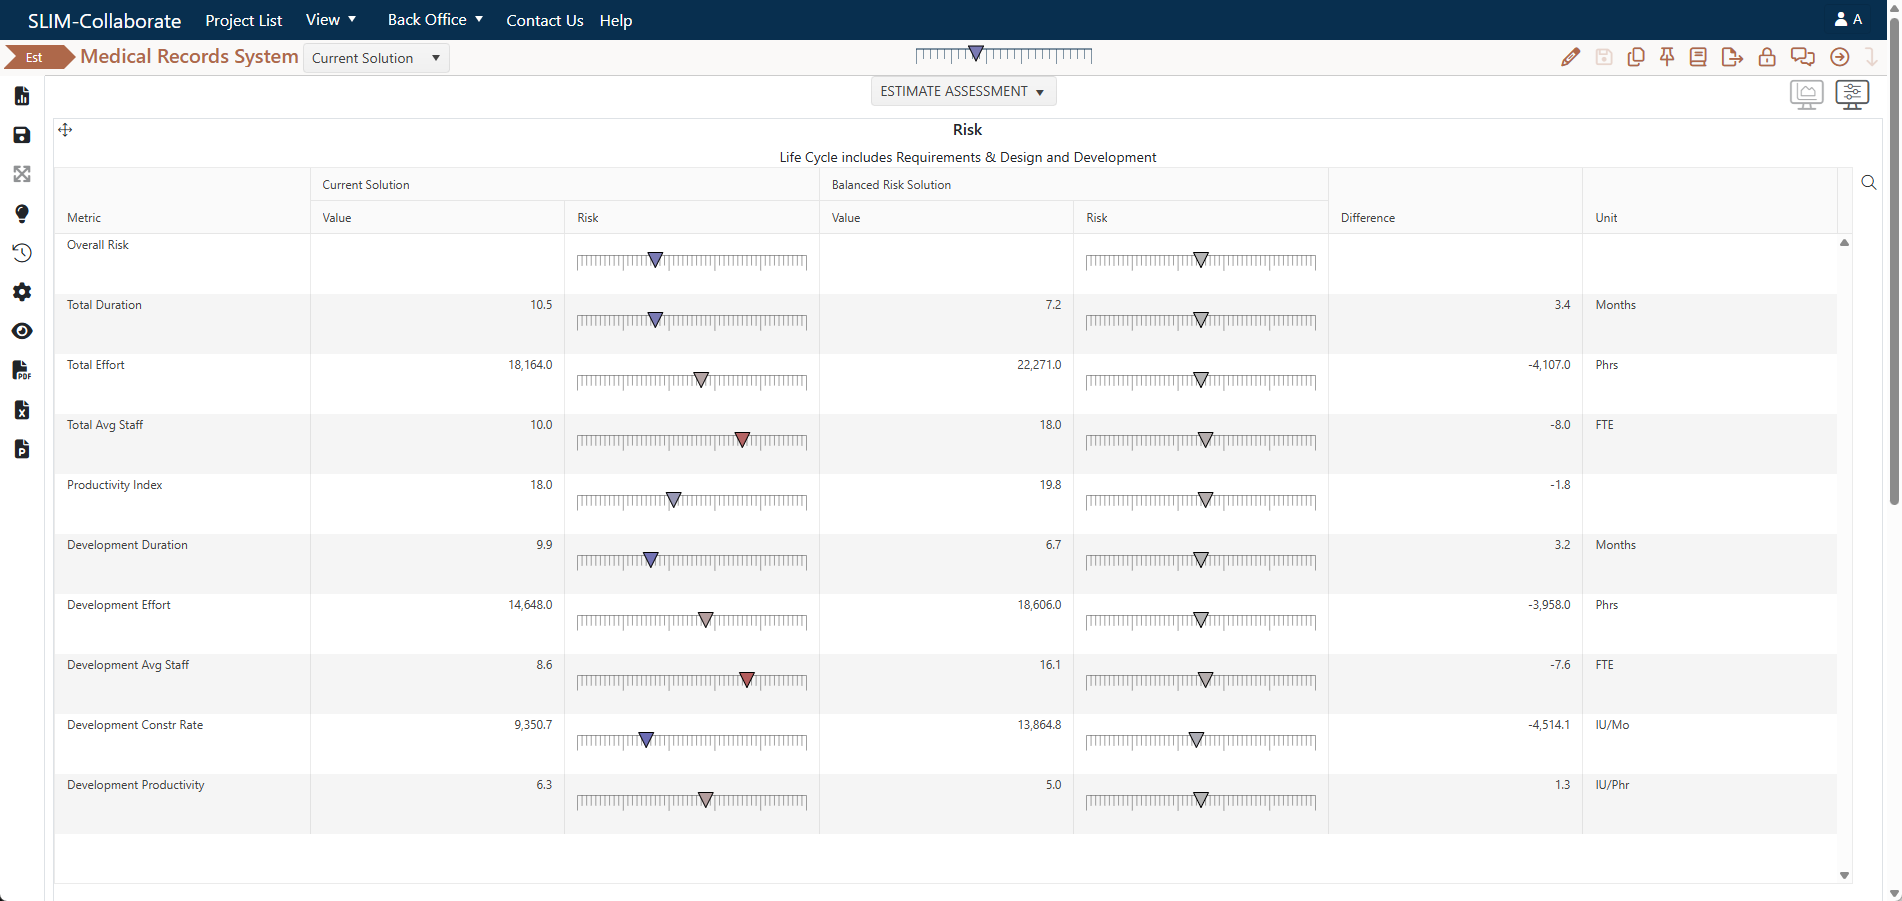
Table listing software project total and development phase duration, cost, effort, staff, and productivity with associated risk rating relative to average industry performance.
Visual risk assessment immediately identifies areas of concern
Beyond Simple AI
  • Blue: Conservative estimates, lower risk, potential inefficiency
  • Grey: Average/Typical, aligned with industry norms
  • Pink/Red: Risky estimates; requires negotiation and mitigation planning
SLIM automatically assesses project risks by comparing your metrics against industry benchmarks from similar-sized projects. The expert system evaluates key performance indicators and flags potential issues using an intuitive color-coded system. Blue indicators represent conservative estimates with lower risk, grey shows average or typical estimates, while pink and red highlight potentially risky assumptions. This visual assessment immediately identifies unrealistic assumptions in schedule, cost, productivity, and quality – before they become problems.
Quadrant Analysis Reveals Opportunities And Risks
Project Portfolio Quadrant Analysis
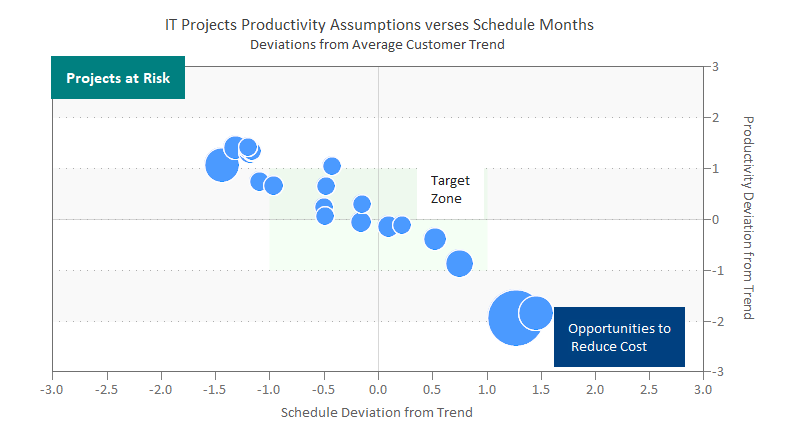
Bubble chart displaying software project cost estimates (bubble) across conversative and risk quadrants
Mapping of projects (blue bubbles) across performance quadrants
Beyond Simple AI
  • Visually map your portfolio
  • Identify at-risk projects early
  • Find cost-saving opportunities
  • Establish realistic dates
  • Balance resources effectively
Transform portfolio management from reactive to proactive
SLIM's quadrant analysis is particularly valuable for identifying project risks in large software programs during early planning stages. The system positions projects on a chart based on key management metrics, productivity and schedule in this example, creating a visual map of your portfolio. This approach not only finds risks but also identifies opportunities for cost savings and helps establish realistic delivery dates. Projects in the Target Zone have balanced productivity and schedule assumptions, representing optimal planning. Those in the Projects at Risk quadrant have aggressive assumptions that require attention and mitigation strategies. The Opportunities to Reduce Cost quadrant highlights projects with conservative estimates where you might be able to improve efficiency.
Monte Carlo Simulation Calculates Confidence Levels
Probability Distribution
Plot of software project total cost on the y-axis versus probability on the x-axis, a calculated range outcomes
Shows the range of possible outcomes (cost, duration, staffing, quality) rather than a single point estimate
Adjustable Uncertainty Levels
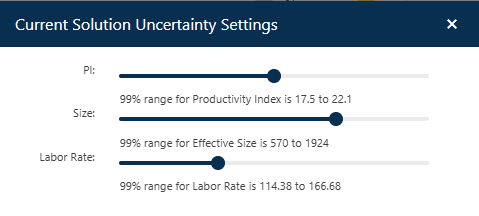
Three horizontal sliding bars used to set the range of uncertainty (99%) of estimates software project size, productivity, and labor rates
Move beyond single-point estimates to realistic ranges
SLIM's Monte Carlo Simulation computes probability distributions for software project outcomes, giving you a realistic view of possible scenarios. This approach helps calculate likely cost and duration ranges with 99% confidence intervals, moving beyond single-point estimates to ranges that reflect reality. You can adjust uncertainty sliders for key estimation inputs − Productivity, Software Size, and Labor Rate − to see how different assumptions affect outcomes. This capability allows project managers to understand potential risks and set appropriate contingency reserves based on their risk tolerance. Projects with proper contingency planning are more likely to meet budget targets, directly improving your delivery performance.
Contingency Charts Enable Negotiation
Compute Higher Assurance Plans
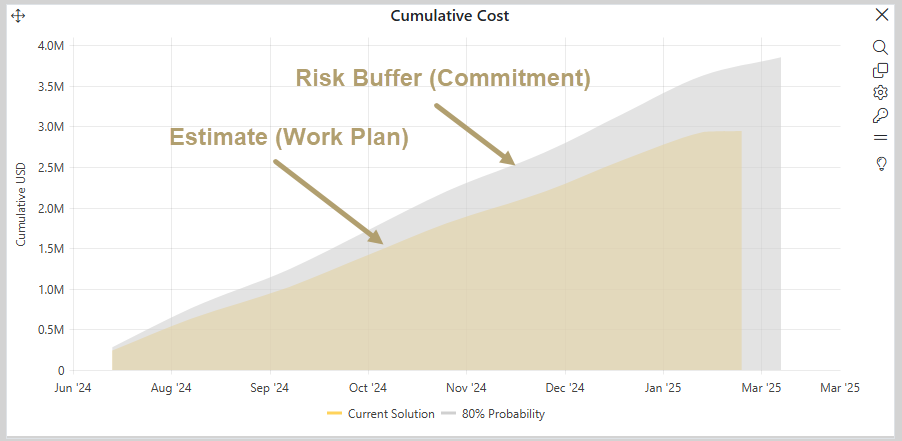
Plot of two curves of cumulative cost versus times, one is the current software project estimate and the other is the risk-buffered solution for 80% contingency
Two Approaches
  • Target Probability: Based on MCS results 65%, 80%, 90% confidence
  • Fixed Percentage: Proportional buffer; Easier to communicate
Time series contingency charts are powerful tools for negotiating with clients and stakeholders about realistic project parameters. SLIM offers two approaches to risk buffering that help you communicate uncertainty appropriately:
  • Target Probability profiles use SLIM's Monte Carlo Simulation results to show 65%, 80%, and 90% confidence levels, allowing stakeholders to choose their risk tolerance.
  • Fixed Percentage profiles add proportional buffers to estimates, which is sometimes easier for stakeholders to understand and accept.
  • Both approaches provide higher assurance estimates of software cost, effort, staff, and schedule, giving you more credibility in planning discussions.
Transform Estimation Into Strategic Advantage
SLIM's AI capabilities can transform estimation from a necessary task into a strategic advantage. It helps optimize projects within constraints, provides in-progress forecasting, and ultimately builds stakeholder trust through more accurate and defensible estimates. Machine learning capabilities analyze patterns across thousands of similar projects to provide insights that would be impossible to discover manually. This transforms estimation from educated guesswork into a strategic advantage that drives better decision-making throughout your organization. We encourage you to test SLIM's AI estimation tools against your historical project data to see the accuracy improvements firsthand.
Optimize Projects Within Real World Constraints
Input Up to Four Constraints
  • Schedule (Duration)
  • Budget (Effort or Cost)
  • Staff
  • Quality
Automatic Solutions for Over-Constrained Projects
"What if I can only have one thing?"
  • Prioritize single constraint
  • Understand implications
"What would it take to succeed?"
  • Balanced compromise solutions
  • Programs emulating domain expertise
SLIM allows you to input up to four constraints with target probability values, including Schedule, Budget, Staff, and Quality requirements. The interactive Risk Gauge visualizes duration and effort tradeoffs, showing you immediately how changes to one parameter affect others. For projects that are over-constrained – where the requirements exceed what's realistically possible – SLIM automatically generates multiple solution strategies. These include "What if I can only have one thing?" solutions that prioritize a single constraint, and "What would it take to succeed?" compromise solutions that balance multiple factors. This capability transforms difficult conversations into productive negotiations based on data rather than opinions.
Defensible Estimates Build Stakeholder Trust
Transform estimation from guesswork to strategic advantage with AI-powered analysis of thousands of similar projects, providing defensible estimates that strengthen stakeholder trust and improve cross-functional relationships. SLIM’s predictive models identify where problems are likely to occur and suggest mitigation strategies based on what has worked in similar situations. High assurance plans, based on the uncertainty of key assumptions, help you effectively communicate risks and enhance your credibility in planning discussions. SLIM AI provides accurate software cost estimates in less time.
Download this Presentation
Need a downloadable copy of the article? Grab a PowerPoint of this article to print, share with your boss, or save for later. Download Now