No one said IT budgeting was easy. It seems like you just finished last year’s budget and now it is time to start all over again. Not only is this task difficult, it is made worse by the fact that most organizations do it in an overly simplistic way. This often results in up to 40% of the projects grossly missing the mark, which wreaks havoc on the enterprise resource plans and results in disappointed business stakeholders.
A large part of successful IT budget planning is identifying grossly unrealistic projects – the ones that are likely to fail and the ones that are ultra conservative and wasteful. Our solution is to perform a basic feasibility assessment on each project as it enters the budgeting process. Ultimately, we will want to make adjustments to these projects, making them more reasonable and improving the overall project performance.
So how is this feasibility assessment done? Start by creating a set of historical trend lines for schedule, effort, and staffing versus size of functionality produced. The trend lines provide a basis for the average capability that could be expected. It also gives us a measure of the typical variability that can be expected. Next, position the initial budget requests against the trend lines. The intention is to identify whether or not the projects are outside of the norm and typical variation; i.e., projects that are high risk or poor value. Figures 1 through 3 highlight some of the techniques used to identify those types of projects.
Figure 1 shows the risk level of the desired outcome of a project. When compared with historical data from the trend lines, the desired schedule of three months and budget of $250,000 would likely not be sufficient to develop 14 requirements. Moving forward with the current estimate would carry a high degree of risk.
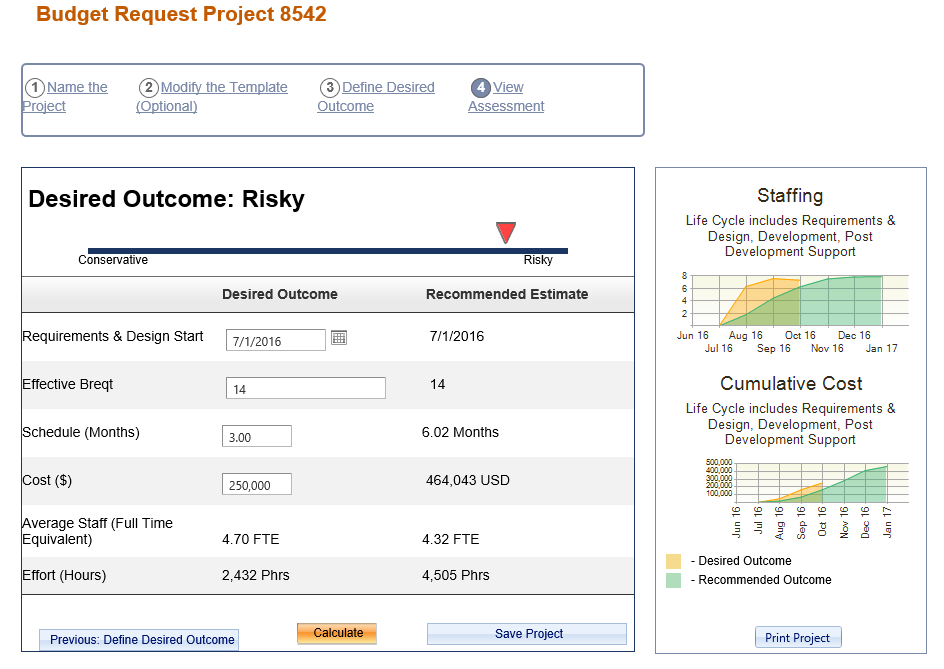
Figure 1. Feasibility assessment of the original budget submission. Notice that the submission or desired outcome is assessed as high risk and a recommended estimate is suggested which is more in line with historical data.
Figure 2 shows the estimate positioned against the historical trend lines for schedule, effort, and productivity. The estimate, depicted by a yellow diamond, falls more than a standard deviation from the average trend line in each area and indicates that, historically, this has happened less than 16% of the time. In this case, the productivity, which is the driving factor, is assumed to be too high, resulting in a risky schedule and too little effort.
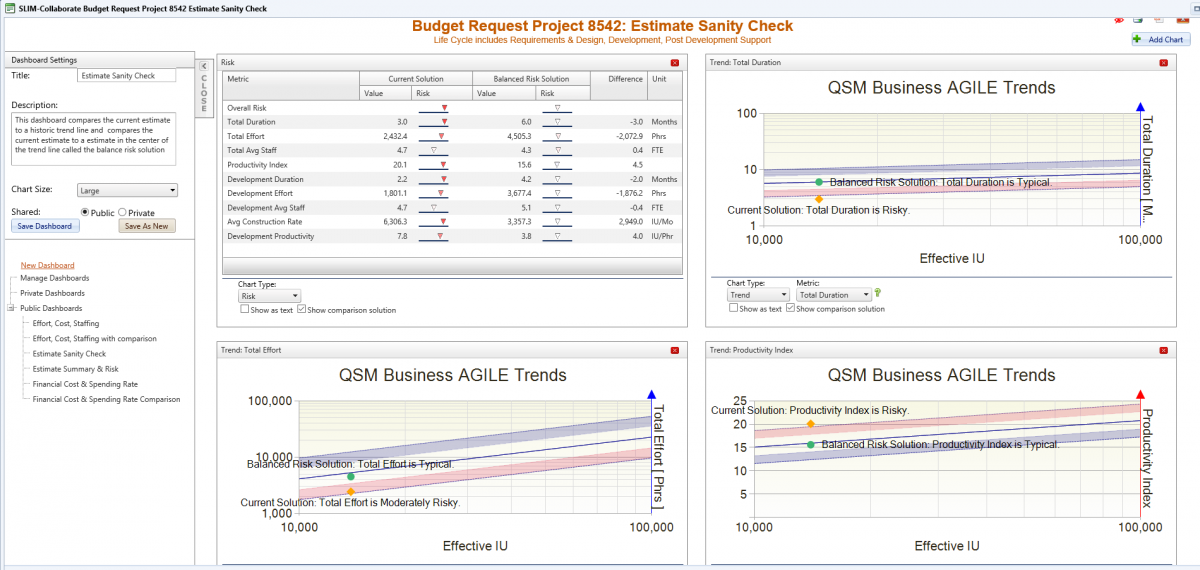
Figure 2. The budget submission (current solution, shown as a yellow diamond) is positioned against the historic trend lines.
Figure 3 shows all the projects relative to schedule and budget (effort). Ideally, the perfect position would be for all projects to be within the green target zone at the center of each graph. In this case, there are several projects with high productivity assumptions and are likely to take additional time and cost more. Those projects are risky (top left quadrant). The projects that are in the bottom right quadrant are opportunities to save money. The productivity assumptions are very conservative for the projects in this quadrant.
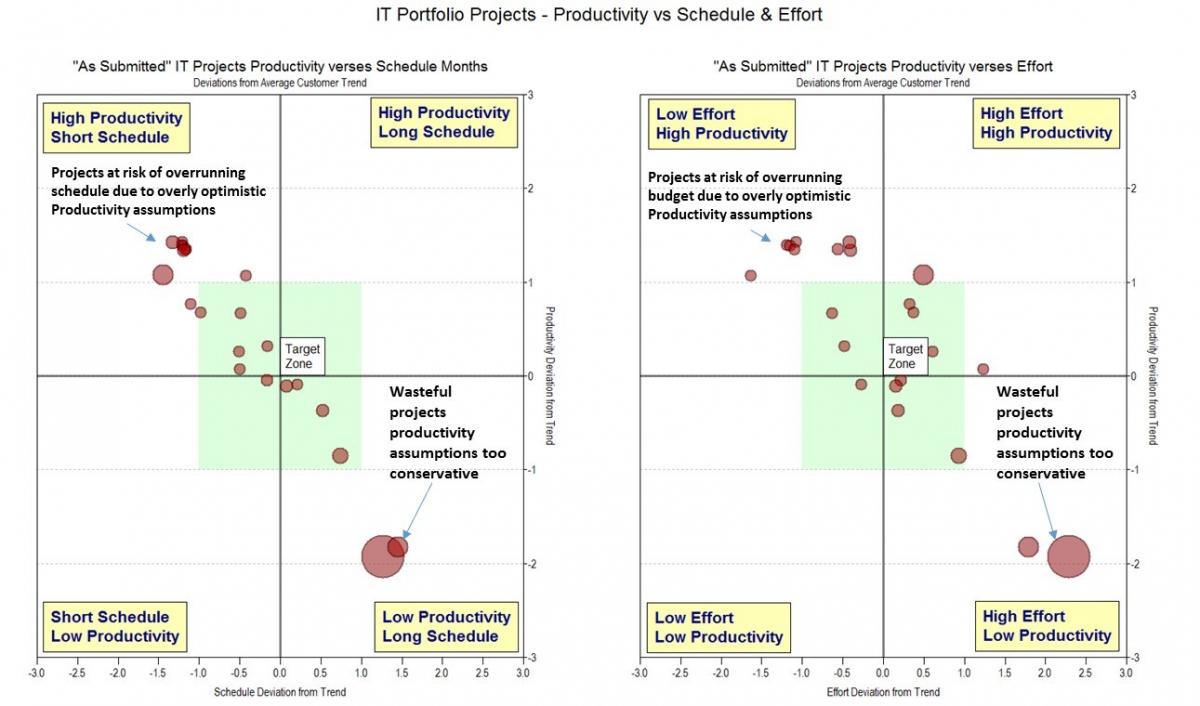
Figure 3. Quadrant chart showing every project’s position relative to having enough schedule and budget.
By leveraging the results of this analysis, we are able to identify wildly unrealistic or particularly conservative project estimates before expectations are set and “locked in concrete.” We can now make adjustments to make project plans more reasonable or completely eliminate the projects that are likely to fail. Having this valuable information early in the IT budget planning process will allow us to maximize organizational resources, build a strong project portfolio, and avoid future project disaster.