Suppose that after much consideration, an organization puts forth an estimate with the intention of carrying it out as a project plan. At this point, many estimators would believe that they are done. However, in order to maximize the benefits of the estimate, it will be necessary to track the project’s progress through completion. While this may seem like a tedious process, project tracking allows for organizations to gain the greatest insight into their software development lifecycles.
To do this, estimators will want to collect data on the current actuals for the following metrics at regular intervals:
- Cumulative Size Produced – this metric is customizable and can include but is not limited to Source Lines of Code, Agile Stories, Screens, etc.
- Monthly Effort – the Person Months or Person Hours expended thus far
- Staff – the number of Full Time Equivalents currently billing time to the project
- Defects – how many errors were discovered
Depending on the length of the project’s schedule, it’s recommended to collect data on the actuals at the end of each month, or for shorter projects at the end of each week. This data can then be compared against the original estimate to track the project’s in-flight progress, as well as any deviations from the estimate. Utilizing these practices can increase accountability within the organization because current statuses are regularly maintained.
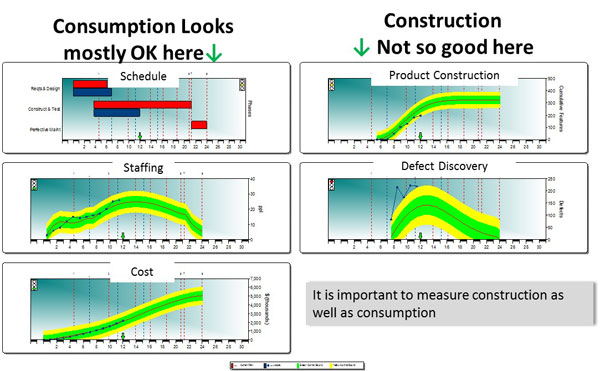
Additionally, tracking these various metrics over time can help identify areas for improvement within an organization. For example, if the project’s actual data match the projected values from the original estimate in staffing and cumulative effort but not cumulative size, this observation could indicate a couple of potential scenarios (see Figure 1). One possible explanation might be that the organization has staffed the project with the correct number of people at a given point in time, but has not appropriately accounted for the skills necessary to complete the project. An excessive number of management personnel may have been staffed for the project, resulting in a decreased staffing allotment for the developers. With fewer developers staffed or those lacking the skills needed for the project, producing code at the estimated rate would be impossible and deviations from the original estimate would be expected.
Another possible explanation for the decreased code production is that the actual productivity of the organization is in fact lower than originally estimated. There are a number of explanations for why this occurs. Introducing new tools, development methodologies, or team members impacts the development environment and can require additional time for developers to perform at the previous productivity level. The next section describes some potential solutions if this happens to your project.

Figure 1. Tracking actuals against the planned values: Consumption vs. construction.
Forecasting and Execution
Life is rarely predictable, and that holds true in software estimation as well. Even the best estimates cannot anticipate some of the curveballs that life throws at them. For instance, if several team members are pulled off the project and temporarily reassigned to another, it is unlikely that the project will progress as originally planned. In such situations, the best suggestion would be to reforecast the estimate.
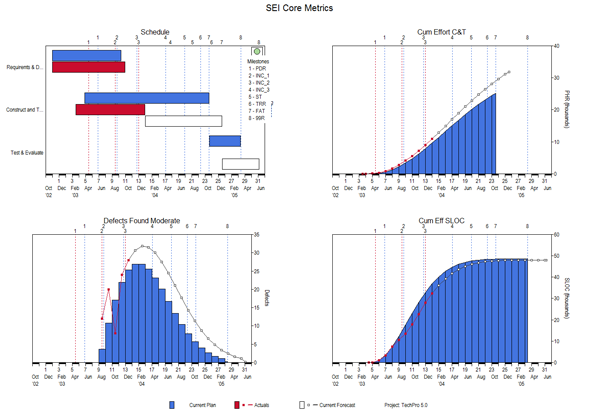
Similar to a GPS, various parametric estimation programs are able to recalculate a new trajectory, or roadmap, if the project gets off track. They factor in what has already been done and re-estimate a new productivity based on the actual values entered. If a project drifts so far off course that the original plan is no longer feasible, a new plan can be implemented and briefed to stakeholders so that everyone has similar expectations (see Figure 2).
In this chart we see the project’s plan in blue compared with the actual data collected in monthly intervals in red. In January, the amount of code produced was slightly below the quota outlined in the plan, yet the cumulative effort expended was above the allotted amount. Additionally, they were finding more defects in the system than initially predicted. Since the project has begun to get off track from the original estimate, the wise choice would be to reforecast the project plan. The new forecast is displayed in white and shows that based on the current trajectory, the project should end about 2.5 months later and require 6,600 more person hours of effort than the original plan. Knowing this information early can allow time for orderly changes while still underway.

Figure 2. Forecasting chart.
One of the greatest benefits of this technique is that it provides transparency into the development process by showing the project’s progress at regular intervals. Development teams know how much functionality will have to be delivered at each interval, and can plan accordingly. If a project begins to drift off course, it’s much easier to determine this from the start and take measures to mitigate risk early. Additionally, as new data is added, the estimation program can reforecast the plan like a GPS would recalculate the roadmap. If the new data shows improvements, it will be reflected in the forecast going forward, thus creating a refined learning system. Having this kind of insight and level of detail up front can dramatically improve accountability across the organization.
Post Mortem
Once a project has reached completion, it’s very easy to move onto the next without a second thought. Regardless of whether the project went really well and the momentum is continuing or if the project was so utterly painful that the wounds are still fresh, a post mortem assessment is always a valuable exercise. Post mortems provide opportunities for teams to discuss what went well and what areas could be improved. Additionally, post mortems allow teams to reconvene at the end of the project to collect the final data for the project repository. This newly completed project can be entered into the estimation data repository along with the rest of the completed project data. A new set of custom trends can then be created using the most recently added historical data, which can be used for more accurate estimates in the future. You will find that over time, this process of collecting historical data, updating trends, and using those trends to estimate future projects allows the estimation process to come full circle, refining itself each time.
Summary
While creating estimates is a great way to start a project off on the right foot, using parametric methods to track and monitor your project’s progress provides even greater insight into the development of your project. Knowing the status of a project in flight and having the ability to share that with developers and stakeholders, when most can merely guess, is extremely beneficial and puts project managers in a much more powerful position. The project can be tracked all the way through completion, at which point, a post mortem assessment can be done to collect data and further refine the estimation process. Using this model creates a refinement cycle whereby collecting accurate data leads to creating more accurate estimates.
