As we were idly reading a recent issue of Insight, the opening sentence of its first article caused us to pause:
“When most people think of a software metrics program, they usually imagine using software measures to monitor and evaluate the status of a program.”1
That’s funny, we mused. We primarily thought of metrics as something with which you make estimates. Of course, we’re not “most people.” What all do most people use metrics for? Perhaps only two or three applications?
We began to jot down the possible applications and came up with a dozen. People could get much more mileage out of their metrics by using them in many ways rather than just one way. Wider use of metrics would spread the cost of training people to keep them, collecting them, tabulating them, and keeping them readily available on a database. Moreover, and even more important, wider usage would make software development run better
A dozen uses for the basic metrics
Look over the following list. Are there any you are not using? Would using one more of them solve one of your problems?
- Macro-estimating, that is, estimating the schedule and cost (and perhaps the bid price) for upcoming jobs, based on a “macro-estimate” of the size of the proposed system and the productivity of your organization.
- Evaluating bids, that is, as a buyer of software development, using a software estimating system to assess whether incoming bids are reasonable. For instance, as the buyer you have an idea of the likely size of the proposed system. From previous experience with the bidders you have an idea of their level of process productivity. If you have no experience with them, you could 1) ask for some historic data to find it out or, 2) assume that it is average for the type of applications they are doing. Given size and process productivity, you compute effort and time, not precisely, of course, but well enough to see that some bids are just unrealistic. Moreover, as you amass some experience in evaluating bids, you will get better. (We have a large client who has been doing these evaluations for most of the 90s and is very happy with the results.)
- Evaluating bids in house, that is, at the higher levels in large organizations where projects are finally signed off, you can do the same thing—or have a small staff organization do it. In this case your database can tell you what the process productivity of the software organization proposing to do the work actually is. The only “unknown” is the size of the proposed system, but you can exercise judgment there.
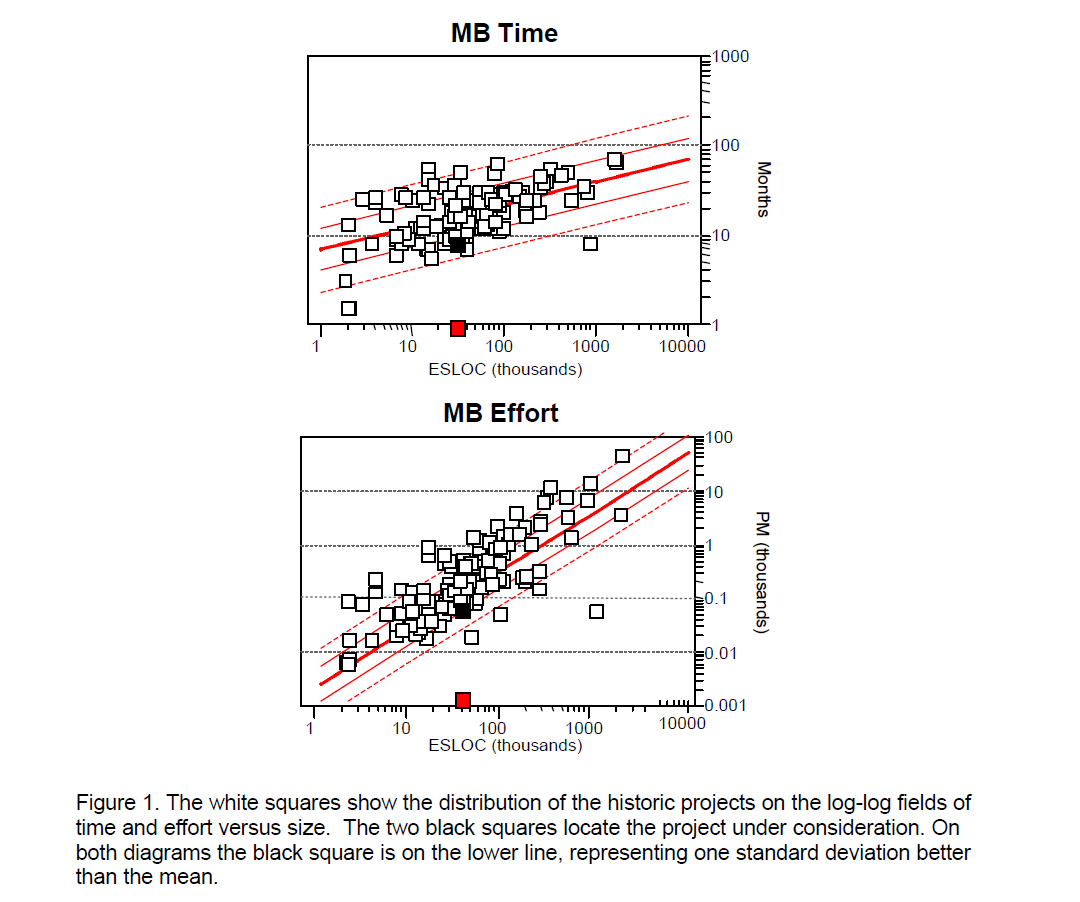
- Comparing estimate with history, your own or that of the application area you are in, as reflected in the large QSM database. The results of past projects, now known, are plotted on two fields. One is effort vs size; the other is development time vs size, diagrammed in Figure 1. You put the proposed estimate (solid black squares) on these charts. Is it in line with your history or QSM’s industry-wide history?
- Micro-estimating, that is, estimating the cost and schedule for upcoming jobs, based on “micro-estimates” of the time and effort each leg of something like a PERT diagram will take or each item in a work breakdown structure will involve. Of course, those little time-andeffort estimates come from metrics kept on past jobs.
- Allocating resources—after the job comes in, you know the schedule and budget that has been decided upon. Now you have to spread that person-hours budget along the time line and divide it among the various job specialties and groups.
- Predicting code completion—the number of lines of code completed and unit tested does not exactly follow the resource allocation curve, but it is the best indicator of project progress. It is not quite the same as it used to be for at least two reasons. First, leading organizations are doing more requirements investigation, architecture development, risk abatement, analysis,and design up front. Completed code is coming later, but faster when it does come, because the problems have been worked out first. Second, component-based and COTS development reuses previously developed building blocks; so there is less new code to count. But putting the components together and testing them takes time and effort that does not show up in a simple count of the new code.
- Predicting defects per month along the project time line.
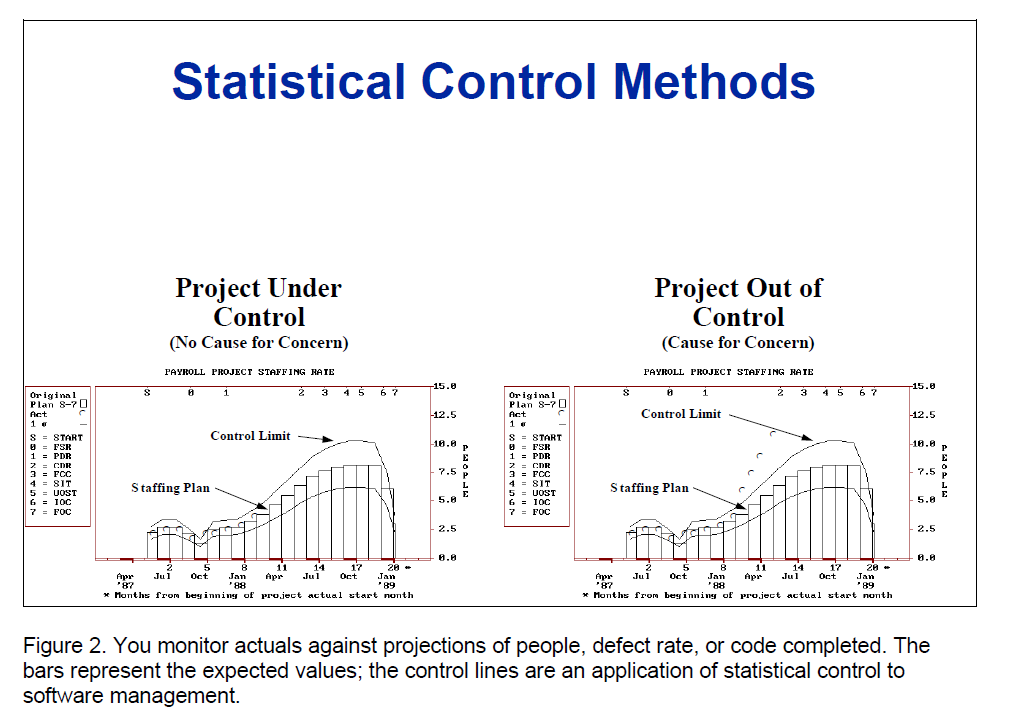
- Progress assessment—you compare planned or projected resource consumption, code completion, and defect rates and milestone completions against the actuals as work progresses, as diagrammed in Figure 2. Deviations from what you expect ring alarm bells, enabling you to take corrective action before it is too late. (We are not claiming that these four comparisons are all there are to progress assessment. There are inspections, reviews, walkthrough assessments, and good, old “walking around management.” But the comparisons of metrics-projected against metrics-achieved help a lot.)
- Process improvement—you compare the metrics on projects completed this year against those of projects completed last year and the year before. In particular, you compare the process productivity of projects completed this year against that of projects completed in previous years. Figure 3 shows how the process-productivity index of a current project (black square) compares with a company’s record to date (white bars).
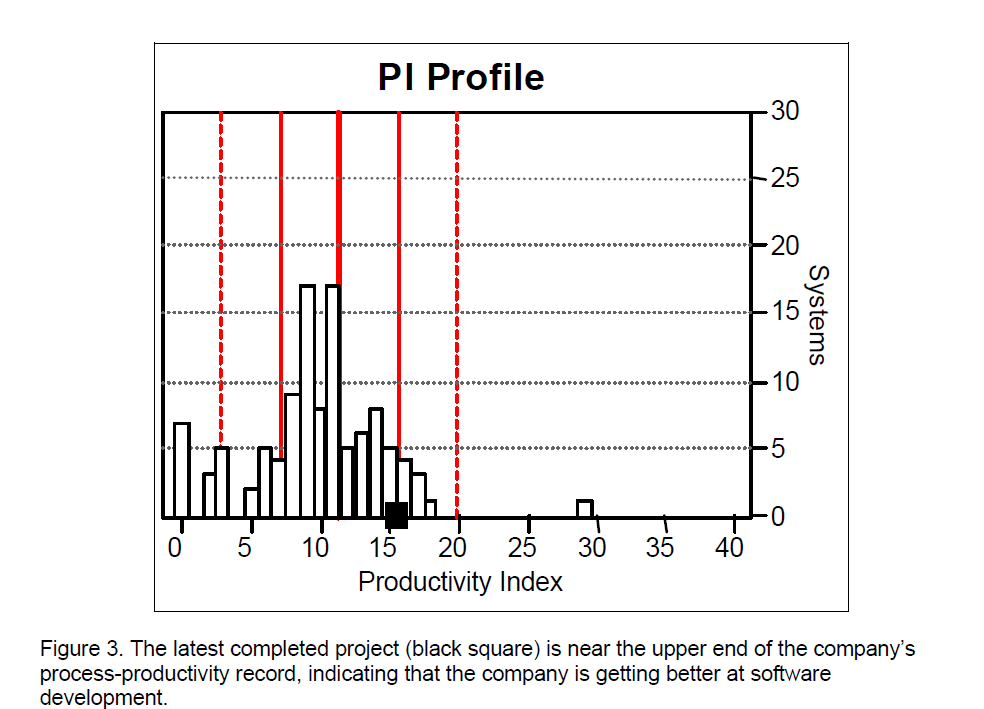
- This is a comparison of actuals against actuals, because process productivity is derived from three numbers that, for past projects, are very real: size, schedule time, and effort (person-months). At least, they can be real if you go to some trouble to standardize your collection practices.
- The metric for process productivity is real in several other senses, too. It is not just size/effort (SLOC/person-month) as conventional productivity is. It is size/ (effort1/3 x time4/3). That is, it includes development time, as The Mythical Man-Month urges. Moreover, both the effort and time terms are raised to powers, thus taking into account the nonlinear nature of software development.
- And the comparison is not of person against person. It is of one project against another project. That leads us to our first negative.
–1. Do not derive evaluations of individuals from your project metrics. Give them pay increases on some other basis. Project metrics is too important to be twisted into futility by people anxious to avoid personal responsibility.
2.Project improvement—the level of management above the projects can use process productivity as an index of the standing of its project organizations. Again you should strive to use this index constructively—to provide additional help, training, mentoring to those projects below the organization-wide average. Try to provide ways for the below-average projects to learn from the above-average projects. That suggests our second negative.
-2. Do not let these comparative process-productivity standings enter into your merit ratings of the project managers. There are lots of other factors in play: difficulty of the application, relations with the client; people assigned to the project; degree to which the project is feasible, and so on.
3.Project replanning—one of the intermediate milestone assessments indicates that the project is in trouble. On the metrics or criteria you are evaluating progress (usually milestones, code production rate, and defect rate), the project seems to be falling behind. Perhaps you planned the project on the basis of estimated process productivity and got it wrong. The plan is no longer valid. When you are 25 percent or more along in a project, it is possible to compute a new process productivity from the time, effort, and size numbers up to that point. With a revised process-productivity metric, you can replan the balance of the project. The new plan, based on actual experience to date, gives you a firm basis for renegotiating the financial arrangement under which the project is operating.
A dozen applications for the price of only four basic metrics
Scores of software metrics have been proposed and each of them has been used successfully by at least the organization that conceived it. Our dozen applications are based on only four measured metrics: size (function), effort, time, and defect rate. A fifth metric, process productivity, is derived from the first three. From these four measured metrics and one derived metric, we project the metrics with which we can manage a project: function, schedule, effort (cost), and defect rate. That is a very good return for the effort you invest in metrics. Just do it!
- 1. “Using Metrics for Software Estimation,” Insight: the Army’s Software Metrics Newsletter, Summer, 1998, pp. 1, 6-9.