“Look there, Fred, he hit a key,” said Frank Gilbreth VI, looking through the one-way mirror between the observation room and a software developer at work in front of a desktop computer.
“OK, write it down, but it doesn’t mean much,” Frederick Taylor VII replied. “He was just turning off the screen saver.”
OK, we needn’t follow these two (imaginary) descendants of Frederick Taylor, the founder of scientific management, and Frank Gilbreth, the time and motion expert, any further. Their methods, developed a hundred years ago for analyzing physical work, don’t apply to intellectual effort. The question is: what does?
There is a vast amount of intellectual work. The number of blue-collar workers in factories is down to about 17 percent of the labor force in the United States. The number of people making a living out of software is variously estimated at between two and three million in the United States and double that world wide. The result of their work has to meet the test of the marketplace. That test is that the return must cover the costs incurred in getting there. Unfortunately, finding the value of “costs” and “returns” comes rather late in the game. Software organizations would like to know “how they are doing” as they are doing it. That means metrics. We could count the number of times a developer scratches his head in puzzlement, but that would be silly. It would not be a good metric of what his brain is putting out.
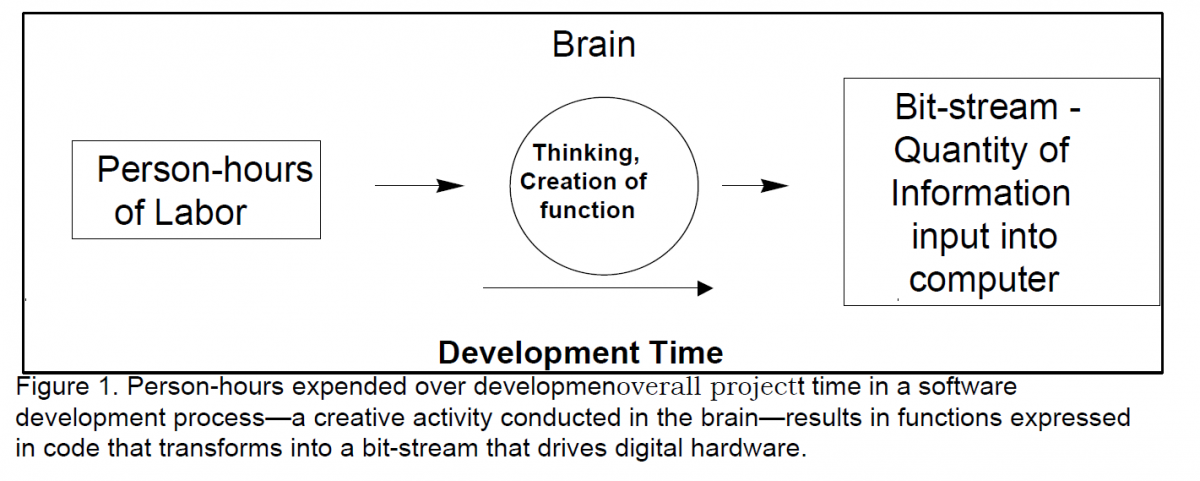
However, at the output end of the software development process, there is a product that is objectively measurable. It is the bit-stream that feeds the digital machines, as shown in Figure 1. This bit-stream is information in the sense that Claude Shannon worked out in “The Mathematical Theory of Communication” in 1948.
Can Shannon’s way of thinking give us some insight into the measurement of software development? He conceived of communication as taking place through a channel. The channel had (1) a certain capacity or bandwidth—a transfer rate in bits per second. It had (2) a certain amount of “noise,” random electrical signals arising out of the environment that interfered with the transmission of the bits carrying the information. As a result of capacity limitations and noise, some of the bits carrying information were distorted in transmission. That was (3) an “error rate.” Shannon did not concern himself with what the message might mean or how valuable it might be to the recipient. He addressed his inquiry only to these three objectively measurable variables.
What can we count in the software development channel? Well, we can count the person-hours being put into a software development. We can count the length of time the project goes on. We can count the defects along the way to that output. And we can count the output—the number of lines of source code.
The first two counts, effort and development time, represent inputs to the work process.
The last two counts, defects and lines of code, represent the work accomplished in the process. One indicates the quality of that work; the other, the amount of work product. In this column we look further into the work product issue.
Many software people are of the belief that lines of code might be fairly representative of the work involved in coding but can hardly account for the upstream thought process. Coding is the final manifestation of that thought process. Figure 1 shows effort (personhours) being transformed over the entire development time by a software development process driven by brain activity into source code which eventually turns into the bitstream that drives the hardware. It is that brain activity—that design creativity, that perseverance, that complex interfacing to other stakeholders—that we would like to characterize.
At the input, as shown in Figure 1, all we have is person-hours devoted to the creative thought process. At the output, we have a quantity of functionality that is measurable. People have suggested several ways of chunking this functionality: function points, objects, modules, subsystems, reusable components, packages, and others. Some of these are helpful in the sense that they are available earlier in the development process than lines of code. Basically, however, they are indicators of a quantity of function representing different size ‘chunkings’ and attributes, not the number of creative “thought” elements. We can’t seem to come up with a good, countable engineering metric to measure this mental discrimination process directly.
What we have done is evaluate the software development process in some way. At a very basic level there are only three ways. The first, used in the Cocomo cost estimating method, appraises 15 or 20 factors related to the process, such as team capability, product complexity. The second, associated with the Software Engineering Institute’s Capability Maturity Model, lists more than 100 activities which, when incrementally adopted and mastered, will lead a software organization up through five levels of organizational capability. It is evident from experience with these two approaches that the assignment of some kind of [relative] numbers to measure the software process is a difficult task.
Shannon’s way of thinking led us to a third approach, which we have been explaining in this series of articles. It we are to follow Shannon’s path, an explanation of what goes on in the software development channel would have to be based upon measurable quantities, just as he measured capacity, signal-to-noise ratio, and error rate. The measurable numbers (on past projects) are effort, development time, and size. These numbers are themselves solid. They circumscribe the software development channel.
We need another number, something to characterize the rate at which “thought elements” move through the channel. This number appears to be comparable to the “productivity” concept, production per unit time, long used in estimating all kinds of economic activities. However, the conventional productivity value used in software development, source lines of code per person-month, hadn’t worked very well. When we examined the data on hundreds of completed projects, it turned out that development time is implicitly related to effort and the relationship is very non-linear. SLOC/PM, of course, did not recognize the effect of development time. The fact that this relationship exists means that, unless estimators take it into account, the effort is actually indeterminate. It follows then that if the person-months in the conventional productivity equation (SLOC/PM) are indeterminate, the productivity figure itself is indeterminate.
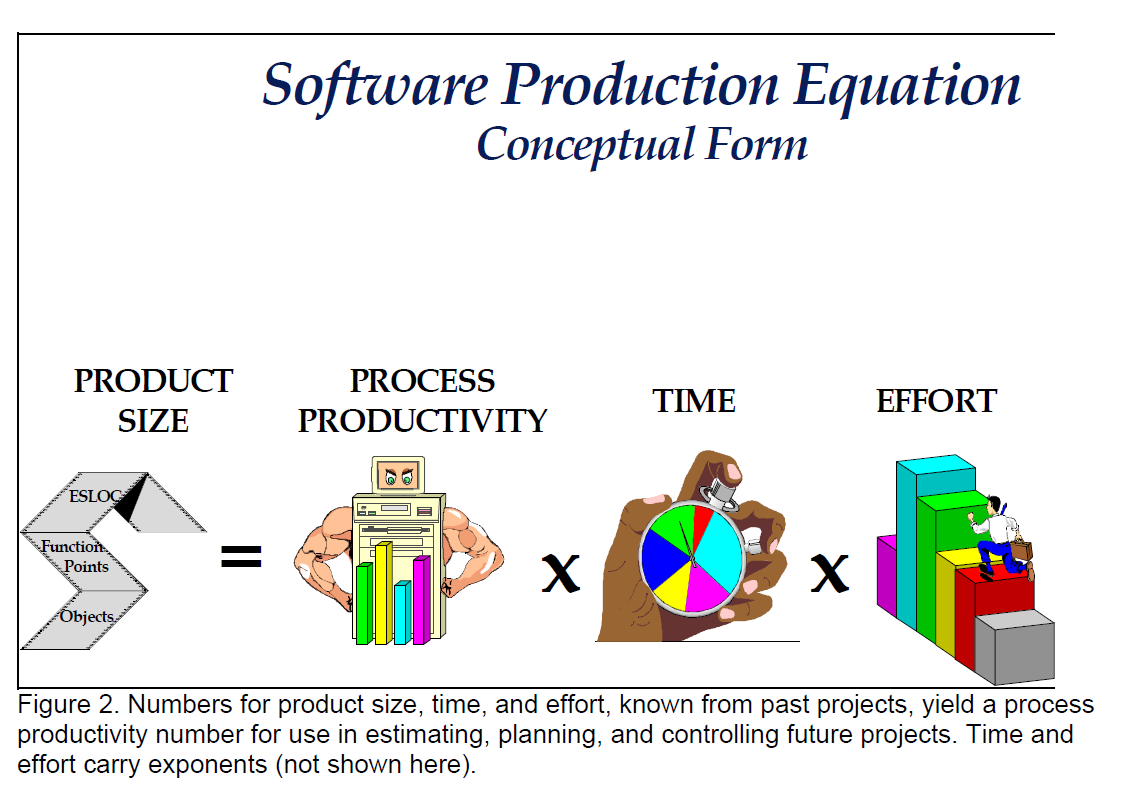
A better indicator of this work rate comes from dividing the one measurable output (the quantity of information expressed in lines of source code) by the two inputs (effort and development time), as presented in Figure 2. We call this indicator, process productivity.
Why does this approach work better than the rather simple measure of productivity, lines of code per person-month (SLOC/PM)? Well, that was the reason it didn’t work: it was rather simple; it came from traditional economic theory of output over input. The non-linear relation between effort and time appears to be a feature of a development project that is not present in traditional theory. This non-linear relationship means that if you try to accomplish a software project in less than a reasonable amount of time, your productivity plummets. Your defect rate spirals up like an unbalanced fireworks. (Shannon would say you have exceeded the bandwidth of the communication channel; noise has started to dominate.)
The reason is that process productivity does vary as a result of the 15 or 20 factors (and probably more) that the Cocomo approach employs or the 100 plus factors identified by the Capability Maturity Model. The best way of putting a number on this multiplicity of factors is to base the number on your own project experience, as reflected in three measurable numbers: size, time, and effort.
As you have no doubt observed in your own practical experience, process productivity ranges widely. Measured according to this software equation (including the exponents), it currently extends from 754 to 2,178, 309. That is a range of 2889 times. No wonder rather simple approaches do not pinpoint a position on this scale very well.
Note that this range reflects the productivity of the process. Productivity of individual programmers—the ability to write lines of code—probably differs no more than a factor of 10 to 40 on a given piece of work. Process productivity, in addition to individual productivity, embodies the effectiveness of the organization, the complexity of the application type, the wisdom of management, and the provision of adequate development time. It is all these factors, each ranging widely, that, when multiplied together, result in an overall range of almost three thousand times. But using the overall project approach with the three historic numbers from a few projects we can position a development organization reasonably well within this enormous range.
In Shannon’s formulation, increasing the bandwidth of the communications channel and/or reducing its noise increases its capacity. In our approach, increasing process productivity (bandwidth) and/or reducing confusion (noise) in the development organization increases its throughput.