“What has metrics done for me lately?” the Chief Information Officer of Fidgety Wicket Corporation growled, paraphrasing the previous evening’s late-night comedian who somehow managed to ask the visiting politician, “What have you done for me lately?” It is a phrase that rings down through our history. If politicians have to take it into account, perhaps we metrics advocates have to pay it some mind, too.
Fidgety Wicket is a big outfit. It has a software development organization of 250 people. That number and the cost of the overall software operation are fairly fixed. The CIO gets as much work done each year with that number as he can, but in 1996, when our story starts, he had 40 systems in backlog, waiting to start. Since his organization was then completing about 20 systems per year, he was two years behind. The organization’s process productivity was near average at a productivity index of 16.
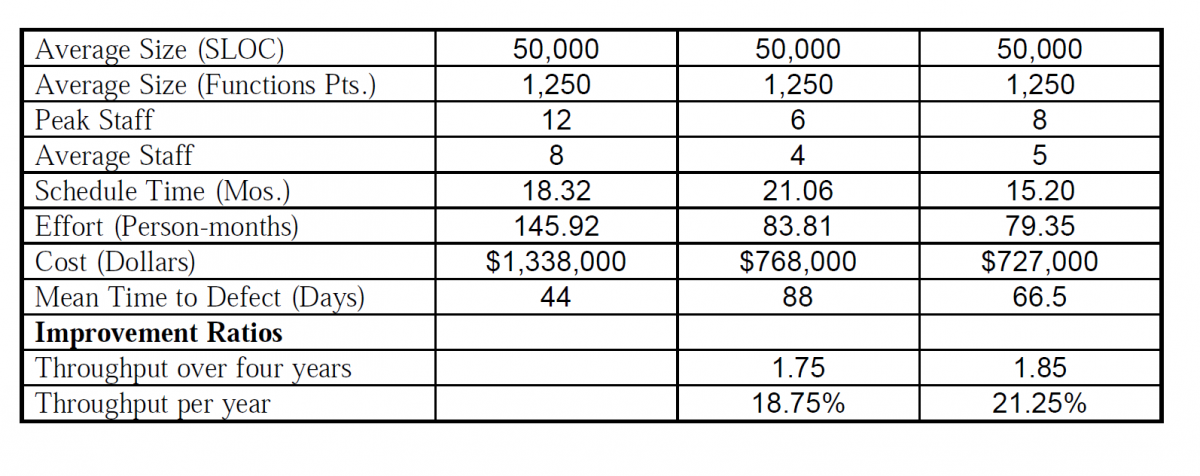
Situation in 1996. Fidgety Wicket’s current metrics are listed in the first column of Table 1. The upper part of the table provides organization-wide data and the lower part, data on an average individual system. The figures in the 1996 column are a baseline against which the company can gauge ways to improve its software development operations. The company considered two approaches. One was to reduce staff by extending schedule a little, taking advantage of the tradeoff law. The second was to improve its overall productivity.
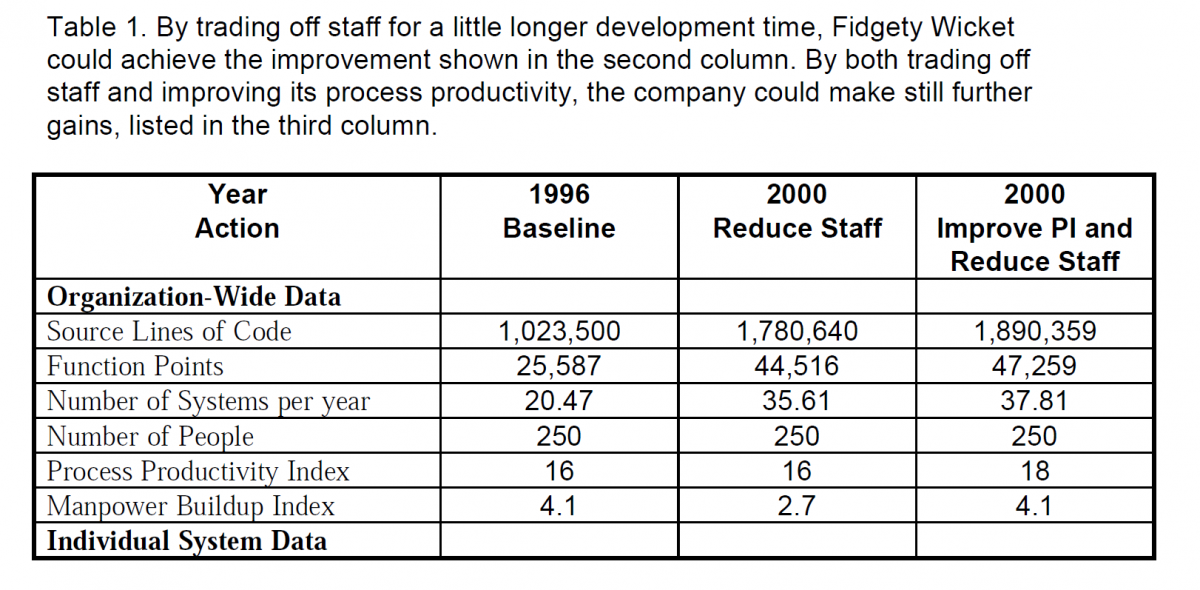
Staff-Time Tradeoff. If the company reduced staff (on its average project) from a peak of 12 to a peak of 6, it could expect, on the basis of the fourth-power tradeoff law, to achieve the figures in the second column. The time sacrifice is that each system, on the average, will take 2.74 months longer. That is 15 percent. It is probably within management’s normal tolerance of schedule length. When deliberately planned, the staff-schedule tradeoff is a viable strategy. Not everything in the systems backlog is priority one. Management can plan to treat the few systems that really are high priority as exceptions to its general policy of using smaller teams.
Look at the gains obtained! On individual projects, effort is nearly halved--from 146 person-months to 84 person-months, with a similar reduction in cost. Average manpower is halved. Mean Time To Defect is nearly doubled. For the software organization as a whole, the number of systems it can complete jumps from 21 to 36 per year. With that gain the CIO can make a dent in his backlog.
Note that column 2 is labeled 2000. Putting a tradeoff practice into effect will take some time. The CIO will have to persuade users who want a system as soon as possible--often for very good reasons--to be patient. Some will be agreeable, happy to take advantage of lower costs and more systems completed over a period of time. Others will be disagreeable, especially at first. Many will come around in a year or two, after they see the results the agreeable fellows are getting. Where users have to pay for the systems they order--through some kind of intra-company funds transfer, they often discover that cost is more important to them than a few months of extra schedule time.
The staff-schedule tradeoff is a one-time gain. Once an organization gets the size of its teams down to the minimum practical level, it can go no further on this route. The remaining alternative is to seek higher process productivity.
Process Improvement. In this scenario (column 3) Fidgety Wicket plans a smaller reduction in project peak staff, from 12 to 8, but it also plans to increase its productivity index from 16 to 18. It plans to make this improvement over four years, or one index point every two years. This rate is reasonable as the business database has been improving about one index point every 2.5 years over the last 10 years.
Thus, even with a somewhat lesser reduction in project staff, but with an improvement in productivity, the company can still expect a substantial reduction in project schedule-20 percent from its current time, or 28 percent from the tradeoff only plan. Effort and cost are reduced still further. Overall, there is a slight gain in the number of systems that can be completed each year, compared to the first plan.
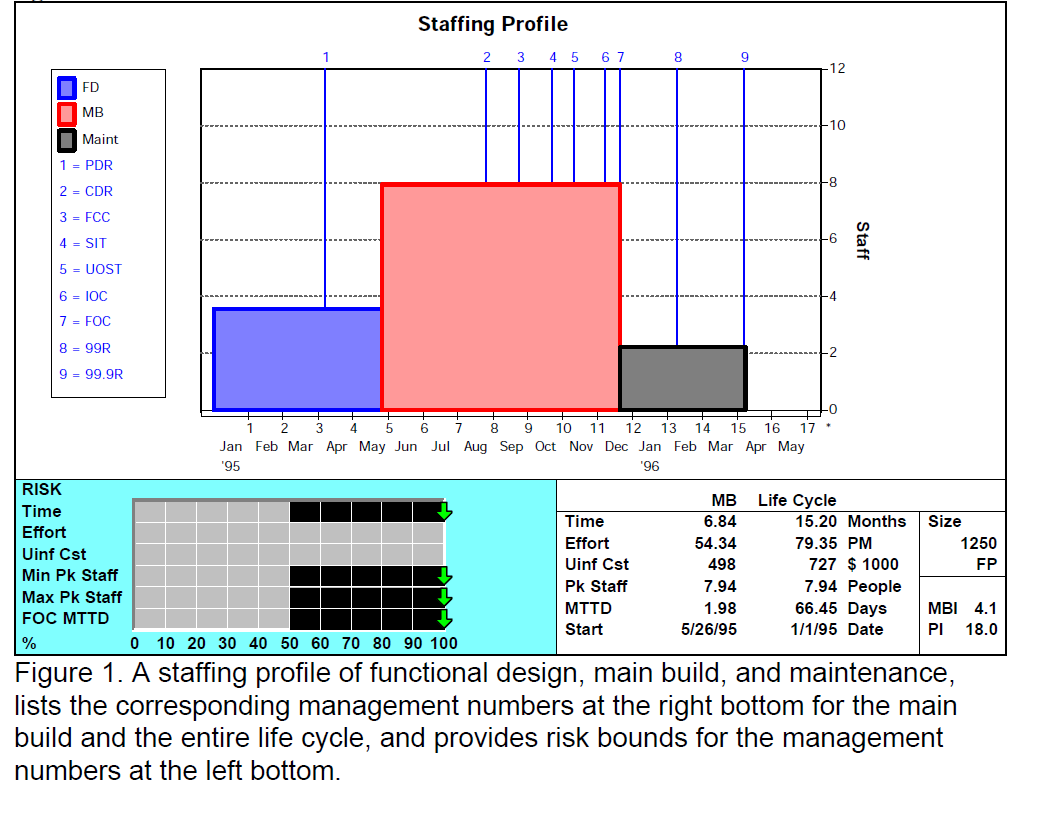
Further plans feasible. The two plans summarized in Table 1 are examples of “what if” analysis. If he wants to, the CIO could look at additional possibilities. QSM’s software can compute the result of each plan that he thinks of and present a summary of it similar to Figure 1. This figure presents the data for the second plan (column 3). From the data for an average project, planners can readily calculate the company-wide figures.
Planning Rests On Metrics. To know where his software operation was in 1996, the CIO had to have some basic metrics (column 1). To look ahead four years, he had to have a means for projecting metrics to the year 2000 (columns 2 and 3). One of these means is the staff-schedule tradeoff law. Using smaller teams, he would be able to use the staff freed up to take systems out of that dratted backlog.
But trading off people and time could take him only so far, he saw. Beyond that point, he would have to work at increasing productivity. That looked promising. There seemed to be no limit to improving productivity. (That’s right. We have reports of companies as high as PIs of 33.)
In fact, by combining both of these strategies right now, in 1996, he could get benefits of greater magnitude. It would take a lot of planning to get under way. It would take a lot of skill to execute. It would take perseverance to keep knocking down the nay sayers.
“Metrics has done something for me lately,” he thought. “It has let me see where we are and where we might go.”