Work product (at a Quality level) = Efforta x Timeb x Process Productivity
That statement expresses the relationship among the five principal metrics of the software process that we reached in our last column, Get a Little Whip! In that article we went on to develop the nonlinear relationship between Size, Effort, Time, and Process Productivity, as follows:
Size = (Effort/B)(1/3) x Time(4/3) x Process Productivity
Size is one descriptor of the functionality of the software product. That functionality, however, exists at a quality level. In this column, we are going to consider one of the quality descriptors, reliability. In later columns we'll take up some of the other quality descriptors. Reliability is usually measured in three ways:
1.Defects, such as total number of defects incurred over the course of developing the product, or defects per week, or defects remaining at the time of delivery. Of course, the latter is not actually known at the time of delivery, though there are ways to predict what it is likely to be. After delivery, the number of defects that turn up during the first month or the first year of operation are counted as they are found.
2.Mean Time To Defect (MTTD), the average time from the discovery of one defect to the discovery of the next defect during development. MTTD is the reciprocal of the defect rate.
3.Mean Time To Failure (MTTF), the average time from one failure to the next failure during operation (including test operation). For this metric, "time" is system operating time. During development, prior to putting the system together for system test, MTTF is not applicable, because there can be no failures until the system begins to operate. Of course, defects will lead to failures when the system is put together. Contrariwise, a failure is caused by a defect.
It is evident, then, that defects are the central culprit in the study of reliability. Reducing their number is our central objective and the issue is: How can we do this? Well, there are many fronts on which we could attack this question, but the one we will address here, this being a metrics newsletter, is: Can we estimate the time planned for the main build in such a way as to minimize the occurrence of defects?
The Defect Pattern is Rayleigh
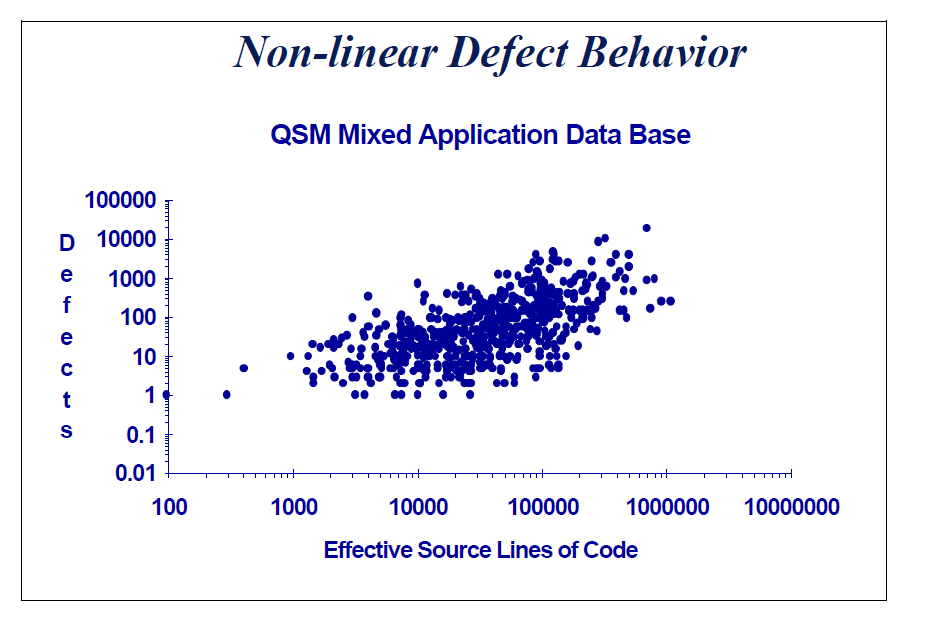
We have already established that the relationship between the four principal metrics or management numbers employed in estimating--size, effort, time, and process productivity--is nonlinear, as shown in the Size relationship at the beginning of this column. Looking at Figure 1, showing the relationship between the number of defects and system size, it appears that the relationship between defects and the estimating numbers is also nonlinear.
In fact, in the course of our research in the early 1980s, we established that the relationship between the number of defects and the estimating parameters is nonlinear. At that time a few organizations had kept defect-rate data over the entire course of the main build and a curve of their defect experience approximated the Rayleigh curve, as diagrammed in Figure 2.
The rate of effort expenditure is often a Rayleigh curve. This seems logical because the rate of committing errors should be proportional to the rate of expending effort. Many organizations have now recorded defect rates and the fact that their pattern of occurrence follows the Rayleigh curve is well established. The area under the Rayleigh curve represents the total number of defects.
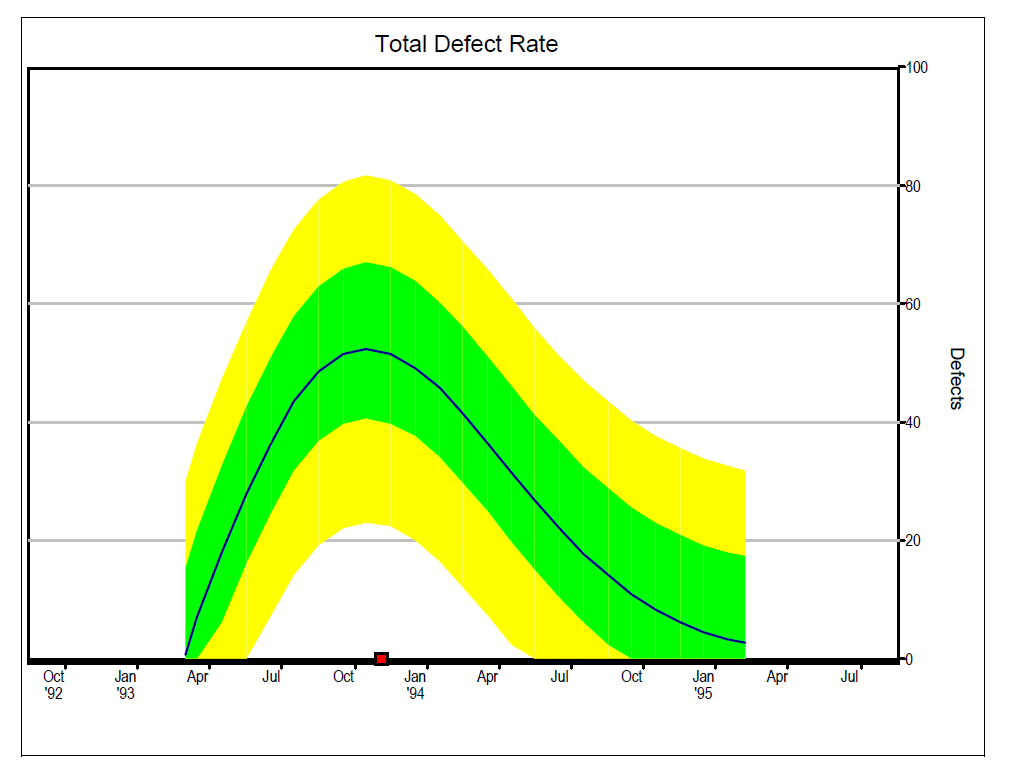
The trailing slope of the Rayleigh curve is similar to the declining exponential curve. It is during this trailing period that system test occurs. Many software investigators, investigating the defect pattern during test, have employed the exponential curve. Using the Rayleigh curve, however, enables us to plot the occurrence of defects during the earlier stages of software development, such as design and implementation. Having this knowledge encourages project people to do something about it, and that, too, is a subject that we will explore in a later column.
Defects are related to the management numbers
The Rayleigh behavior established the defect pattern. The next step was to establish the relationship between defects and the other estimating parameters. By that time we had a large database containing both defect data and size, effort, time, and process-productivity data. From that database we established the relationships. They are indeed nonlinear and they are contained in the QSM estimating tools. The relationships show that the way we plan a project affects the defect rate, the total number of defects, and the number of defects remaining at delivery. In other words, metrics can have a lot to do with reducing defects as early as planning time and effort for the main build. Let's run through the key metrics and see what the relationships tell us to do.
Sise. The larger the proposed system, the larger the number of errors that developers will commit, other things being equal. It follows that there is merit to keeping the system size small. You can do this by planning to build the ultimate system as a series of releases, each one comparatively small. You can avoid features that few of the users need but with which some of the marketing people may be enamoured. Often deferring a feature to a later release avoids doing it at all, because it becomes evident that it is not needed.
You can employ reusable components in which defects have already been reduced by actual use. Reuse, in effect, reduces the size of what you actually work on. The ultimate in "reuse" is buying a shrink-wrap product and "reusing" the whole thing! Of course, one then has to pray that the shrink-wrap producer got the defects out.
Effort. The greater the amount of effort, the larger the number of errors that developers will commit. Therefore, minimize effort by using small teams. Using small teams, you are more likely to be able to staff them with qualified people. Qualified people, of course, make fewer errors, other factors being equal.
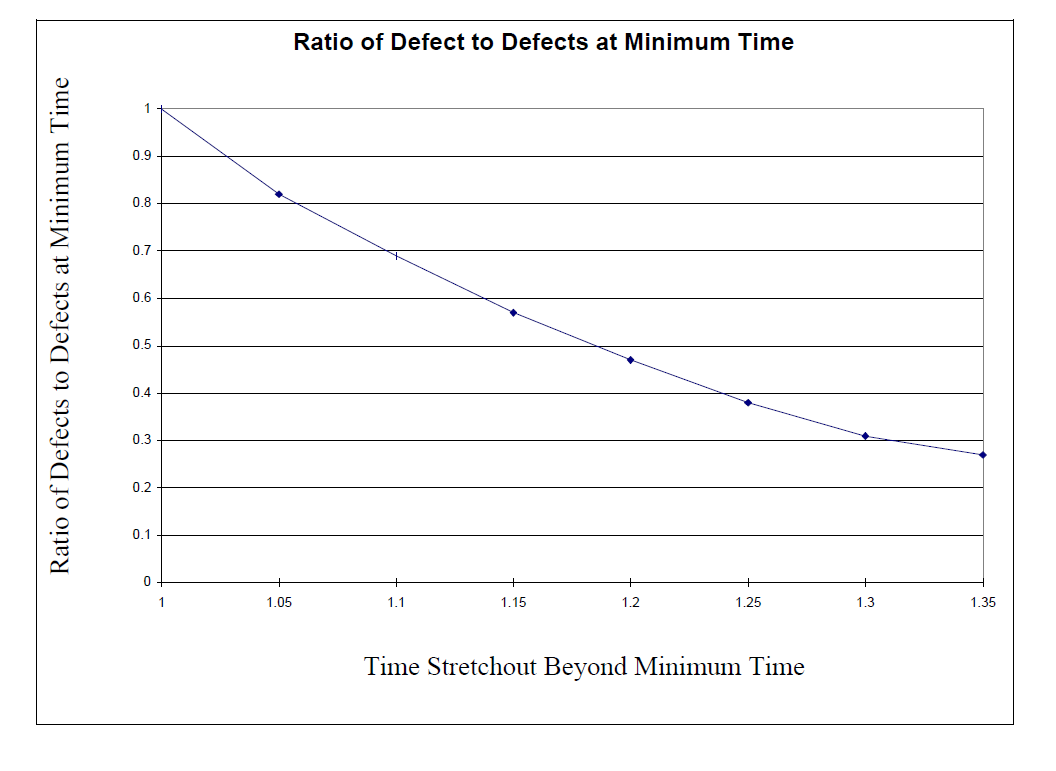
Time. You can reduce effort and employ smaller teams by planning a development time greater than the minimum development time, as we have discussed in previous columns. Planning three more months on a project with a minimum development time of 12 months, for instance, amounts to a 25 percent increase in schedule. That reduces the defects to less than half of what they would have been at the minimum development time, as shown on Figure 3. Really, this tradeoff is just common sense. When people are rushed, and that is the case at the minimum development time, they make more errors. That's how the male half of the development community nick their faces shaving!
Staff buildup. The rate at which the Rayleigh effort curve increases we measure as the manpower buildup rate. A rapid increase leads to a greater number of defects. So you ought to plan to add manpower to your project team at a reasonable rate--no more rapidly than the team can absorb new people. A lot of people thrashing about increases the defect rate.
Process productivity. Better process productivity greatly reduces the number of defects. You can't improve process productivity during the week or two you are planning a project. It is pretty much fixed in the short run. You can improve it over the years to come. Some organizations find it difficult to maintain the management force that drives process improvement over the long term. Completing projects in a shorter time with less effort and having the data to establish those facts is a great motivator, of course. Getting better product reliability and having the facts on defect reduction is another powerful motivator of the effort it takes to improve your process.
Planning the time, effort, process productivity, staff buildup rate, and size reduction that provide the setting for good development is very important, but developers, working within this better framework, still have to work carefully, find their errors, correct them, and do all the other good things that the quality people tell us about. Nothing comes automatically.
Did we mention that users of your software will be very happy with a product that is defect-free? Almost error-free, that is. Nothing is ever perfect (except the girl, or boy, of your dreams).