“The current model leads us to the conclusion that the limiting factor is the rate at which ideas or insights can be generated, and that the rate is not widely affected, if at all, by the number of men on the job, but rather by some capability level of the group.” Peter V. Norden 1
Conventional productivity—source lines of code per person month—is familiar, but it falters in practice. It is little help to a manager trying to carry out his six basic functions: (1) estimating, (2) setting dates, (3) supplying resources, (4) monitoring work progress, (5) assuring product quality, (6) measuring process improvement, as we set forth in the last column. The software industry needs something more, call it FMM + .
The productivity relationship
The answer appears obvious in retrospect, though it was not so clear at the time, back in the 1970s. Software development managers needed a productivity relationship that incorporates not only the amount of work done and the effort devoted to doing it, but also the very important time factor. Probably the pyramid builders had first noticed its importance many thousands of years ago.
One day we discovered that Peter V. Norden of the IBM Development Laboratory, Poughkeepsie, NY, had preceded us in this quest. In the 1950s he had found a relationship between the assignment of people to a research and development project and the development time of the work being done. Further, this relationship could be modeled by a curve (Figure 1), named after Lord Rayleigh, the great British physicist. This curve had an equation, so we could manipulate the time and effort relationships by algebraic methods.
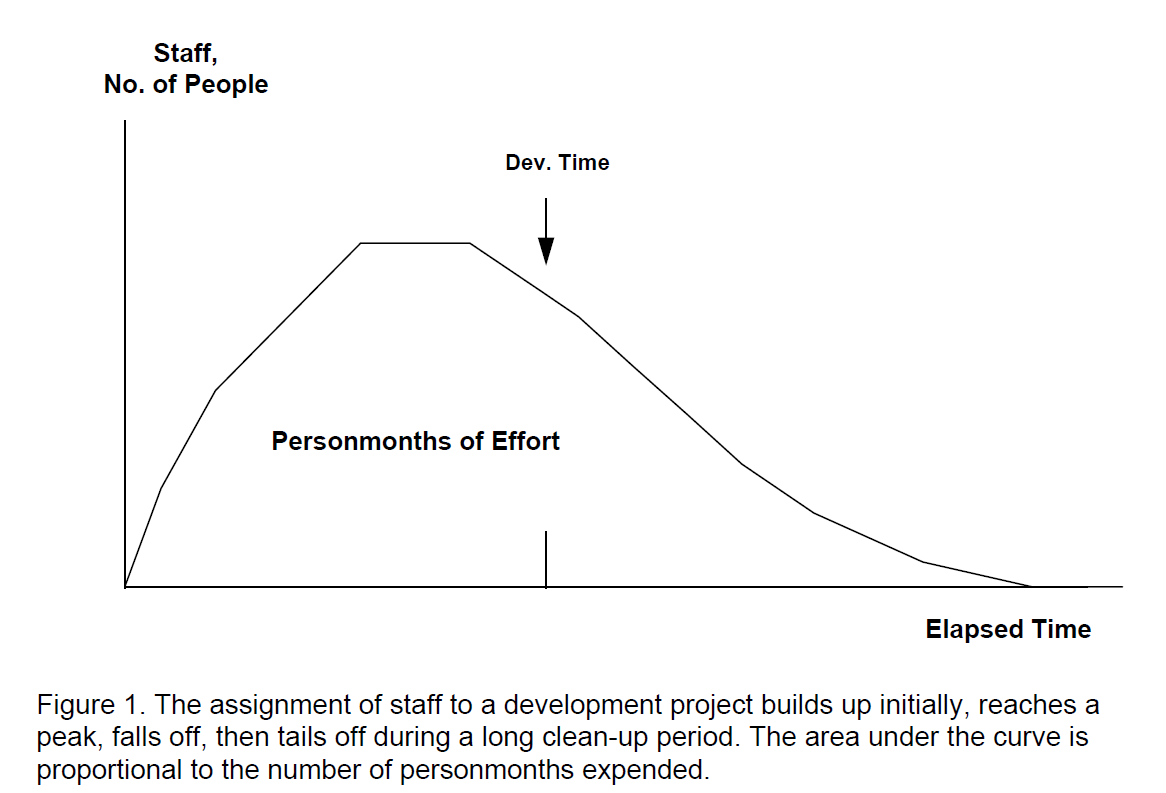
Putnam determined that this pattern also described software development. Given this staff profile, it was just a matter of mathematics to develop the software equation presented in Table 1.
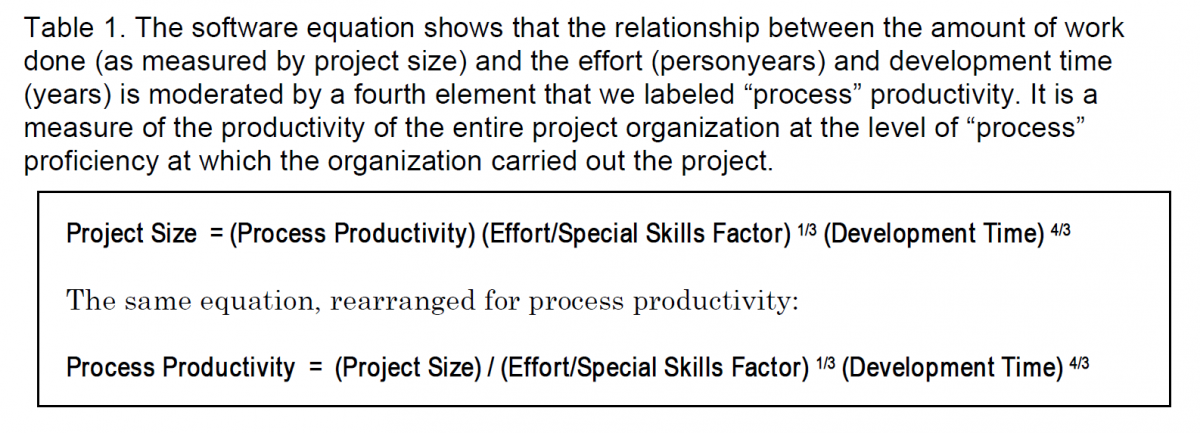
Since the effort, development time, and size numbers apply to an entire project, the corresponding productivity rate is not that of an individual programmer, but that of the entire project organization. At first we called it the “technology constant,” for its likeness to the “constant” found in algebra. Then we called it “organizational productivity,” because it applied to the whole organization. Eventually, with the increasing popularity of the term, process, we called it “process productivity.” By rearranging the terms in the equation, also shown in Table 1, the factors that determine process productivity stand out.
The relationships are nonlinear
In conventional production, output is equal to a productivity term times the amount of effort applied. That is usually a linear equation. Note that the software equation is nonlinear. On the one hand, the effort term is present to the one third power. In other words, we have to take the cube root of the effort, greatly reducing the importance of effort in software relationships. Norden anticipated this finding long ago in the insight quoted above: “The rate is not widely affected, if at all, by the number of men on the job.”
On the other hand, development time, raised to the 1.33 power, carries great weight.
Fred Brooks put it in what he called “outrageously oversimplified” terms in The Mythical Man-Month in 1975: “Adding manpower to a late software project makes it later.” As recently as last spring in a keynote address to the International Conference on Software Engineering, he added, “On balance, I stand by the bald statement as the best zeroth-order approximation to the truth, a rule of thumb to warn managers against blindly making the instinctive fix to a late project.” The software equation reduces insights such as these to a mathematical expression that can be used by managers to carry out their six basic functions. It does four things that conventional productivity does not.
- It represents the productivity of an entire organization on a project, not that of an individual programmer. The productivity of a project organization at its current level of process proficiency is what you want when you deal with the six basic control functions. The productivity of individual developers as a factor in their merit ratings is a can of worms that is best kept separate from project-control matters.
- It represents the productivity of the process during the time period the measurements cover. This period is usually recently completed projects for use in estimating the next round. It can be historical projects for the purpose of gauging the rate of process improvement. It can even be projects currently in work; usually they must be at least 25 percent completed in order for the data to be reasonably valid.
- Because the software equation includes a development-time term, it takes into consideration the effect of the development time planned or allowed.
- Similarly, because it includes a size term, it allows for the effect of size. In general, large projects are more complex than comparable small projects and, other things being equal, process productivity is lower. However, other things are often not equal. To accomplish a large project at all, an organization has to be pretty good.
Finally, with process productivity, you can make better estimates. With better estimates, you can better monitor progress against what the estimate indicates you should expect. With a good indicator of process productivity on current projects, you can see if they are doing better than last year’s projects. You have a measure of improvement justifying the funds you invested in better equipment, tools, and staff training. Moreover, you can turn that measure of improvement into a return-on-investment figure that enables you to justify continued investment in process improvement.
There is much more to be said on these matters of project and investment control— and we will say it in future columns. First, however, we have carried on too long without getting to that very important attribute, software quality and reliability. It, too, can be measured, controlled, and improved. We turn to it in our next column. All for now.
- 1. Peter V. Norden, “Useful Tools for Project Management,” in Operations Research in Research and Development, edited by B. V. Dean, John Wiley & Sons, 1963.