QSM Database

QSM Database

New Video: How to Use Project History for Early Software Decisions

Early project decisions, when not much is known, are easily the hardest. They're also often the most critical. Maybe you've found yourself in a position where you need to communicate to stakeholders what your work is going to cost and how long it will take to deliver. Feeling the pressure to deliver, you might have to make decisions based on gut feel instead of past performance. This can lead to setting unrealistic targets and often results in projects going late or over budget. 

At QSM, this is when we recommend turning to historical data. Whether it's your own data or trendlines from the 13,000 validated projects in the QSM industry database, leveraging actual completed projects can make your estimates more reliable. 

Believe it or not, collecting your own project history isn't as difficult as it sounds. We recommend capturing just a few basic metrics: Functionality Delivered, Total Effort, and Total Duration. Once you have this information, you can calculate a Productivity Index, which is the measure of productivity for the overall project or release. Then all of these metrics can be leveraged by any of the other project lifecycle tools in the SLIM-Suite for estimating, tracking, and benchmarking.

In the video above, you can see how easy it is to gather your own completed projects to use early in the planning process and determine if your estimates are reasonable or not. This helps you understand the big picture before you make any important project or portfolio decisions. 

Circa 2021, What Does a “Typical” Software Project Look Like?

Background

No two software projects are exactly alike. So, one way to find out what a “typical” software project looks like is to take a large sample of completed projects from the QSM historical database of over 13,000 completed software projects and look at measurements of central tendency for staff, effort, size, schedule duration, and productivity.

For this study, QSM looked at validated projects that completed beginning in 2010. We eliminated 1 person projects and those that expended less than 1 person month of effort. The eliminated projects accounted for 13% of the sample. About 80% of the projects fell into the Business IT application domain, many of which were from the financial services sector. This domain includes projects that typically automate common business functions such as payroll, financial transactions, personnel, order entry, inventory management, materials handling, warranty and maintenance products. We determined both a median and an average for each metric. With the exception of schedule (project duration), these differed significantly which indicates that that the sample metric values were not normally distributed. To minimize the effect of unrepresentative projects (those that comprise a small part of the sample, but whose metric values are very large or very small), we decided to use the medians – values with 50% of the projects above and 50% below the “average” as a better measure of central tendency.

The "Typical" Project

Metric

Median

Average Staff (Full Time Equivalent)

4.87

Top 5 Resources for Increasing Software Development Predictability in 2020

Top 5 Software Estimation Resources in 2019
As we enter a new decade, it's important to take a look back at where we've been. The past 10 years saw the introduction of the Ipad, Microsoft Azure, Uber, 4G networks, and Instagram. Some might look back and call this the era of cloud computing and artificial intelligence with increased connectivity and efficiency in technology like never before. But software development goals have remained largely the same: to reduce cost and time to market, increase quality and maintainability, and allocate resources more efficiently. I'm willing to bet those goals will not change in the coming decade. At QSM, we have always believed that the only way to combat the unknown is with practical measurement and metrics grounded in data from our past. As we look to 2020, let's take a look at our top 5 resources from 2019, featuring the most current insights from our industry experts on the state of software estimation and project management and development trends. 

What better way to get a bird's eye view of software development's history than with a look at long-term trends? Leveraging QSM's industry database of over 13,000+ completed projects, Katie Costantini's "Long Term Trends from 40 Years of Completed Software Project Data" took a high-level look at changes to software schedules, effort/cost, productivity, size, and reliability metrics from 1980 to 2019. The study compared insights to similar studies QSM has completed at regular intervals over the past four decades and answered questions like, 'what is the "typical" project over time?' and 'why are projects "shrinking?"

Blog Post Categories 
Metrics Estimation QSM Database

New Resource: QSM Software Almanac: 2019 Edition

QSM Software Almanac: 2019 Edition

We are pleased to announce the release of the QSM Software Almanac: 2019 Edition, an essential resource for anyone involved in the planning, management, or budgeting of software and systems projects and portfolios. This year's almanac focuses on agile development and the continued relevance and application of estimation and metrics.

The 2019 Almanac presents 18 articles from several perspectives, including both private and public. These articles show that there is indeed a compelling need to apply the basic principles of software estimation to projects, regardless of the methodology used, and that traditional metrics – even sizing metrics – can and should be applied to agile projects. Over the course of this book, the authors examine agile sizing approaches, effort and productivity, estimation best practices, as well as project and portfolio management best practices. All the articles offer research and insights into the foundational skills associated with parametric estimation and adapting those existing skills to account for changing conditions.    

Much of the content in the 2019 QSM Software Almanac is derived from the QSM Metrics Database, drawing data from over 13,000 completed software projects from North and South America, Australia, Europe, Africa, and Asia, representing over 1.2 billion lines of code, 600+ development languages, and 120 million person hours of effort.

We invite you to download the full, complimentary version of the 2019 QSM Almanac below.

Blog Post Categories 
Articles QSM News QSM Database Agile Estimation

What Our Major QSM Database Update Means to the Software and IT Community

QSM Database Update

This post was originally published on Linkedin. Join the QSM Linkedin Group and Company Page to stay up-to-date with more content like this.

QSM recently announced a major update to the QSM Software Project Database, a large and robust body of data that helps software and IT professionals estimate the cost, time and effort requirements for their software and systems projects. As a result, QSM clients and SLIM Suite users can benefit from the most up-to-date and expansive software project benchmarking data, particularly in the agile domain.

With this large update, we’ve validated and added more than 2,500 new projects across nine major application domains (Avionics, IT, Command & Control, Microcode, Process Control, Real Time, Scientific, System Software, and Telecom) and 45 sub-domains. The result is a database with more than 13,000 completed projects, extending what is already the largest continuously updated software project metrics database in the world.

With these enhanced data insights -- all gathered from real-world projects -- SLIM Suite users have access to the most up-to-date software project benchmarking data and can quickly and easily sanity-check estimates against industry data.

IT and Agile Projects Get a Boost

Blog Post Categories 
QSM Database Agile

QSM Database Now Includes More Than 13,000 Completed Projects

QSM is pleased to announce a major update to the QSM Database, the largest continuously-updated software project performance metrics database in the world. With this update, we have validated and added more than 2,500 projects to the database in 9 major application domains (Avionics, IT, Command & Control, Microcode, Process Control, Real Time, Scientific, System Software, and Telecom) and 45 sub-domains, resulting in a current total of more than 13,000 completed projects.

With this update, the number of agile projects in the database increased by 340%, resulting in some changes to the agile trend line. Specifically:

Blog Post Categories 
QSM Database Metrics SLIM Suite

The 2017 Software Almanac: Development Research Series

QSM Software Almanac: 2017 Edition

Software plays an increasingly vital role in our everyday lives. It powers everything from autonomous cars and aircraft, life-saving medical equipment, and the data that allows the government to protect our country. When companies develop software, there’s no room for error. 

That’s why software predictive analysis and estimation are still extremely important. Last year, with the release of the 2016 Software Almanac, we learned that the last 35 years of predictive analytics and estimation principles were still incredibly relevant for providing reliable and applicable business intelligence for implementing successful software projects.

This year’s version of QSM’s annual Software Almanac further strengthens those findings. The 2017 Software Almanac builds on the principles identified in last year’s publication and highlights the dangers of not applying predictive analysis and estimation processes.   As stated by Angela Maria Lungu, Almanac Editor and Managing Director at QSM, these principles can be a “double-edged rearview mirror.” If you move forward without applying the historical principles of estimation and analysis correctly, their value is diminished.   Here’s what else you can expect from this year’s Almanac:

Blog Post Categories 
Articles QSM Database

Top Programming Languages Revisited

Mike Harris at the Davis Consulting Group blog links to a 2014 list of 11 Essential Programming Languages from Baseline Magazine:

If you want to learn about the hottest programming languages today, don't miss this list from IEEE Spectrum. This respected organization, which has 400,000 members and is considered the world's largest association of technology professionals, enlisted the services of Nick Diakopoulos, a well-known computational journalist and assistant professor at the University of Maryland, to compile the language rankings. Diakopoulos proceeded by weighing and combining 12 metrics from 10 sources, including IEEE Xplore, Google and GitHub. The result is a compilation of languages that cover big data analytics, graphics, system administration, network programming and virtually every other tech-supported function.

IEEE’s interactive list, which you can explore here, generates customized rankings for various sectors (Web, embedded, enterprise). In evaluating the results, it makes sense to ask, “What makes a programming language, ‘essential’?” Language popularity can be measured several ways:

Blog Post Categories 
Languages QSM Database

The "Typical Software Project" Over Time

What does a typical software project in the QSM historical database look like, and how has “what’s typical” changed over time? To find out, we segmented our IT sample by decade and looked at the average schedule, effort, team size, new and modified code delivered, productivity, language, and target industry for each 10 year time period.

The QSM benchmark database represents:

  • 8,000+ Business projects completed and put into production since 1980.
  • Over 600 million total source lines of code (SLOC).
  • 2.6 million total function points.
  • Over 100 million person hours of effort.
  • 600+ programming languages.

During the 1980s, the typical software project in our database delivered 154% more new and modified code, took 52% longer, and used 58% more effort than today’s projects.   The table below captures these changes:

Blog Post Categories 
Team Size Languages QSM Database Effort

Data-Less Decision Making

I rather enjoyed the Google Analytics April Fools prank earlier this month, Welcome to Data-Less Decision Making on Analytics Academy.  Though satirical, this video brings to light an important reason why individuals have such trouble making decisions in a business environment: they don’t have data.

I’ll agree that without data it’s really appealing to turn to the coin flip method and be done with it.  After all, 50/50 odds really aren’t terrible, right?  But project management software such as SLIM-Estimate make empirically-based business decisions possible, even when company data isn’t immediately available.

Leveraging our database that contains over 10,000 projects, QSM has developed and regularly updates 17 distinct industry trends.  When creating an estimate or benchmarking a past performance, simply select the QSM industry trend that most closely reflects the type of system being built.  This will serve as a reference point.

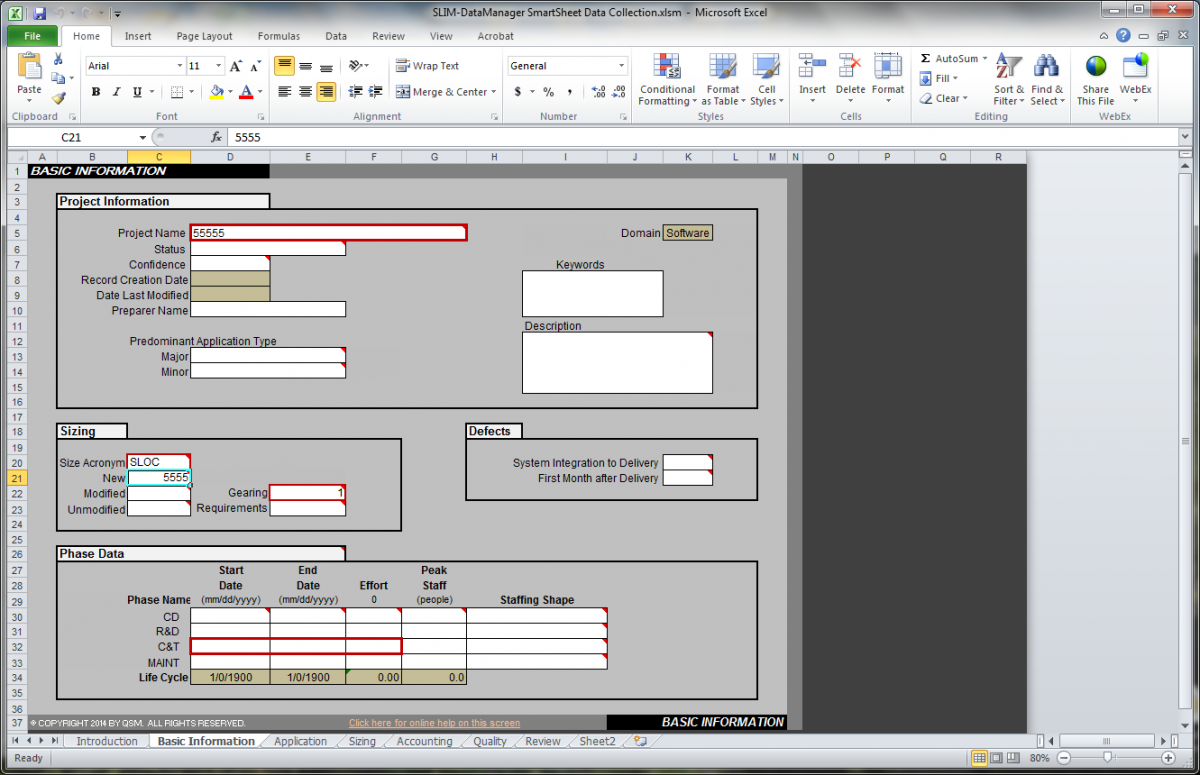
If historical data is available but you’re unsure of which metrics to collect, SLIM-SmartSheets is a new downloadable feature in SLIM version 8.2 that mimics the look and feel of SLIM-DataManager and allows users to collect project data, even when they’re not on a network computer.  Each project can then be pulled into one SLIM-DataManager file using the API.  

SLIM-SmartSheets