What Makes a Software Performance Benchmark Truly Meaningful?
What would sports be without performance statistics? They are the lifeblood of the decision-making process every day. Individual athlete and team rankings, salaries, college drafts and trades, and now sports gambling.

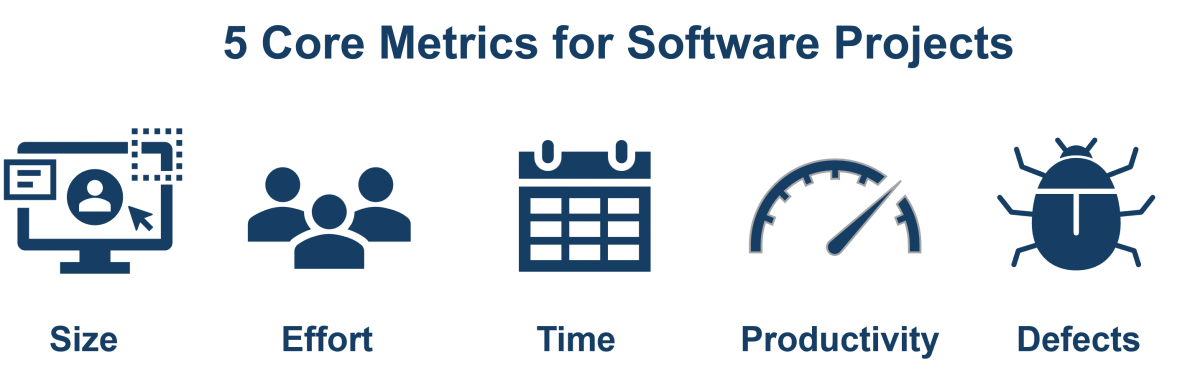
If you are using software development metrics to assess performance and guide process improvement initiatives, great! Including software size metrics provides the context and insight you need to establish a level playing field.
We have covered many of the benefits, concepts, and how-tos of software size measurement throughout our Software Size Matters video series. In this episode, we conclude our series by showing you why software size metrics are critical to performance benchmarking and estimate validation.