Quantitative Software Management (QSM) consultant, James Heires, recently discussed the benefits of estimating and forecasting software reliability at RAMS (Reliability & Maintainability Symposium) 2023. Theme for the conference: "Artificial Intelligence and Machine Learning (AI/ML) application to our R&M tools, techniques, and processes (and products) promises speed and scale.... When program management instantiates advanced techniques into R&M engineering activities, such as digital design and machine learning and other advanced analytics, it enables products to evolve at a much more proactive, effective, and cost-efficient approach. Ultimately it facilitates increased speed to market, adoption of new technology, and especially for repairable systems, products that are more reliable, maintainable, and supportable."
James describes how the push towards Continuous Integration / Continuous Delivery (CI/CD) of military software engineering, time-to-market objectives have been supplemented with ongoing oversight and control. The Defense Science Board (DSB) recommended in their final report (Feb 2018) that a “software factory” concept be emphasized in the source selection process. To support this concept and the digital transformation of reliability and maintainability (R&M), contractors will need to enable and begin to practice CI/CD to stay competitive on DoD development programs. Measurement, modeling and analysis techniques can be leveraged to ensure software development efforts meet reliability expectations while practicing CI/CD.
Program managers tend to think about the reliability of their software only when the customer finds defects in the field, causing delays and monetary impact. Because software defects are the fundamental drivers of software product reliability, it stands to reason that routine predictive modeling of software reliability would benefit all stakeholders.
 Estimating and forecasting software reliability requires some specialized methods (e.g., curve-fitting, estimation models) and should be leveraged to explore the impact on software quality and/or reliability before a product development effort begins (and periodically throughout the development lifecycle). James explains some models in use and shares actual examples of DoD programs making use of this functionality to predict field reliability of software programs, including the effectiveness of dynamic models, such as SLIM-Suite®, that use actual defect discovery rates over time (defects per week or month) from an ongoing project to forecast.
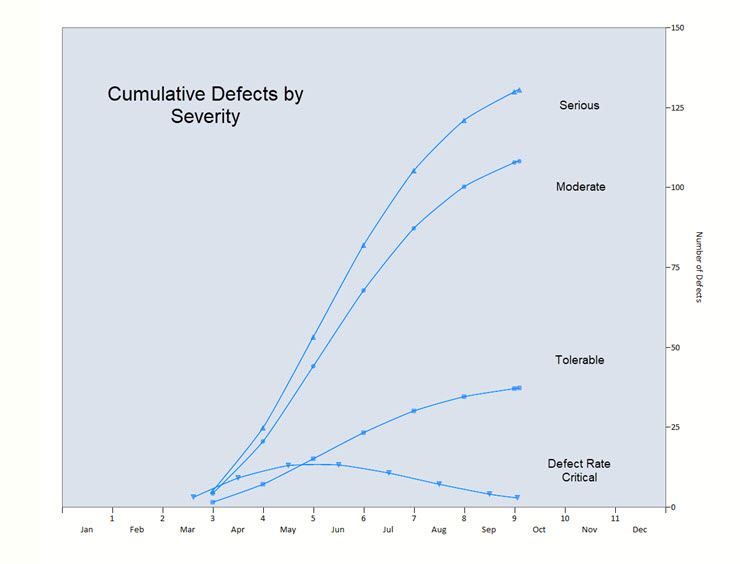
Research performed by QSM, Inc. founder, Lawrence H. Putnam, Sr. (Putnam and Myers) shows that defect rates follow a predictable pattern over the project lifecycle. Initially, staffing is relatively low and few project tasks have been completed. Defect creation and discovery increase or decrease as a function of effort and work completion. As people are added to the project and the volume of completed code grows, the defect discovery rate rises to a peak and then declines as work tails off and the project approaches the desired reliability goals. This characteristic pattern is well described by the Weibull family of curves (which includes the Rayleigh model used in SLIM®).
Defect rates have another useful aspect; they can be used to calculate the MTTD (Mean Time to Defect). MTTD is analogous to Mean Time to Failure. It measures reliability from the user’s perspective at a given point in time, typically when the system is put into production for the first time.
How should organizations determine the right reliability standard for each project? A good place to start is by asking, “What does the software do?” and “How reliable do we need it to be?” Defect rates, taken in isolation, aren’t terribly helpful in this regard. Software developers need to know how long the software should run in production before users encounter defects of various severities.
Download the presentation to learn more.