QSM Database

QSM Database

A Year in Review

As 2013 begins to wind down and everyone begins making plans for 2014, I wanted to take a moment to reflect on all the projects we’ve worked on this year.  Despite our relatively small company size, we’ve managed to accomplish quite a bit over the last year.  Below, I’ll recap everything we’ve been up to and also highlight some of our great resources and publications in case you missed them earlier:

QSM Announces Latest Update to the QSM Project Database

We are pleased to announce the the latest update to the QSM Project Database! The 8th edition of this database includes more than 10,000 completed real-time, engineering and IT projects from 19 different industry sectors.

The QSM Database is the cornerstone of our business. We leverage this project intelligence to keep our products current with the latest tools and methods, to support our consulting services, to inform our customers as they move into new areas, and to develop better predictive algorithms. It ensures that the SLIM Suite of tools is providing customers with the best intelligence to identify and mitigate risk and efficiently estimate project scope, leading to projects that are delivered on-time and on-budget. In addition, the database supports our benchmarking services, allowing QSM clients to quickly see how they compare with the latest industry trends.

To learn more about the project data included in our latest update, visit the QSM Database page.

Blog Post Categories 
QSM Database

Agile Series Part 1: The "Typical" Agile Project

After spending the past few weeks working with the Agile projects in QSM’s historical database, I’ve become interested in Agile Development Theory, particularly due to its popularity. While spending days at a time examining our database, I’m left with numerous data-driven questions. Therefore, I thought I would take this opportunity to write a series of Agile-related blog posts.

QSM’s database contains over 100 Agile projects from the U.S. and abroad. The projects include a variety of application types and their top three programming languages were JAVA, C++, and VB.NET.  Seeing this, I thought it might be interesting to examine the “typical” Agile project according to our data.

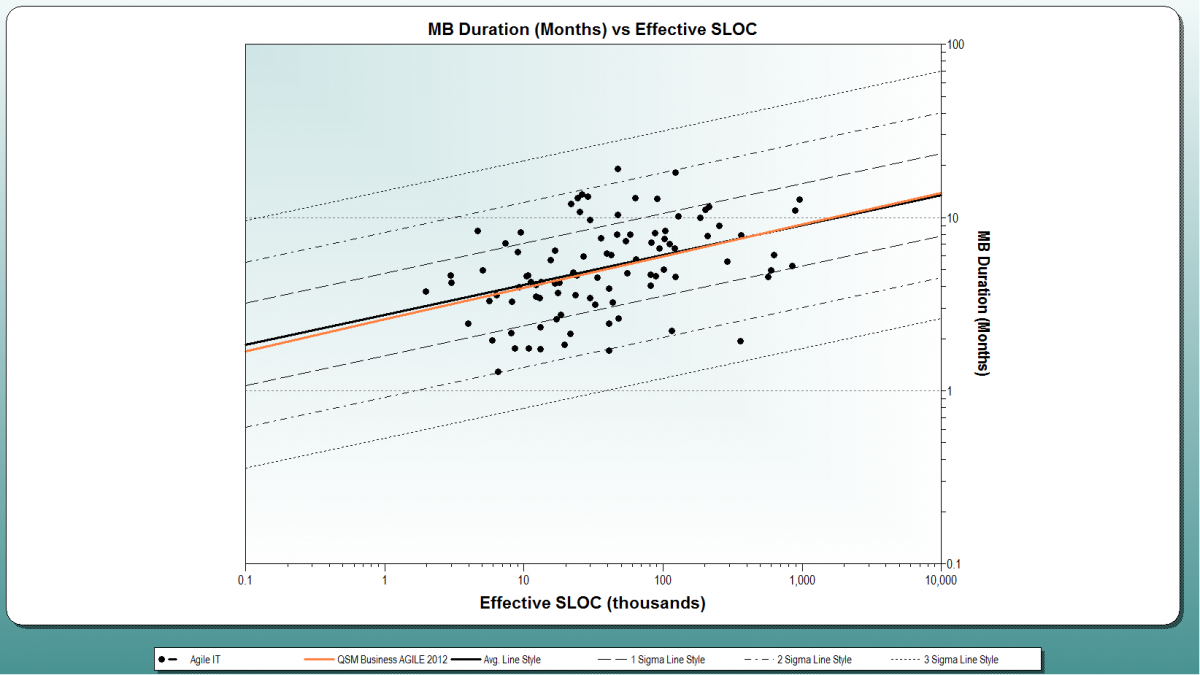
So what does the “typical” Agile project look like? For consistency purposes, I limited the sample to IT systems projects completed in the last six years. I measured the Duration, Effort, Average Staff, and MTTD at various project sizes to see how they compare.

Below are two figures that give demographic information about our “typical” Agile projects: 

Typical Agile Project

This scatter plot shows the individual Agile projects compared against QSM’s Business Agile trends.

Size (SLOC)

Duration (Months)

Effort (PHR)

Average Staff

Blog Post Categories 
Agile QSM Database

Top 25 Programming Languages since 2008

Top 25 Programming Languages since 2008

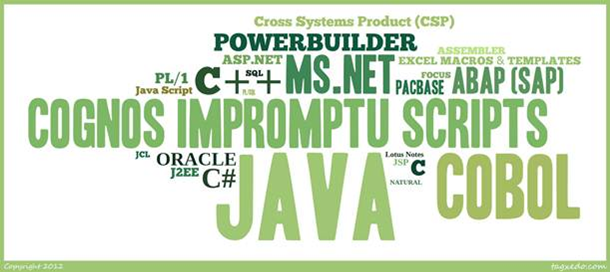
In response to my previous post, I made a new word cloud for the top 25 programming languages in the QSM historical database from 2008 to present.

One striking difference between this word cloud and the last week's is that the font sizes are much smaller, due to the smaller sample size. Since word clouds use font size to represent size within a sample, this is expected since the entire QSM database is larger than the sample from 2008 to present. 

Unlike last week's cloud, Java is the predominant programming language since 2008. Java represents 26% of the sample since 2008 while COBOL, the #1 programming language in the entire database, holds only 11% of this sample. According to Langpop.com, a site which ranks the popularity of programming languages using search results, Java ranks second in the Normalized Comparison chart, just below C.  

In Programming Language Trends: An Empirical Study, a paper from the New Jersey Institute of Technology, the authors attempt to predict the popularity of programming languages by using regression analysis which focuses on intrinsic and extrinsic factors.  

Blog Post Categories 
Languages QSM Database

Top 25 Programming Languages Visualized

Top 25 Programming Languages

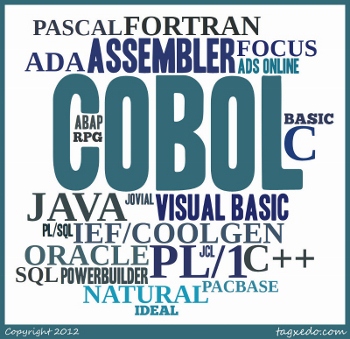
Since I began working with SLIM-Metrics and the QSM historical database, I've been interested in unique ways to present information.  I've written before about how others pair data and design to visualize patterns, but this is my first attempt: a word cloud.  

A word cloud is a graphical representation of how often a word is used within a sample.  The larger the font in the word cloud, the more often it is used in the sample.  Word clouds are a great tool for displaying sensitive data without having to use numbers.  The above word cloud visualizes the entire QSM database, going back three decades.

What I like about this visualization is that at a glance, you can tell that more projects use PL/1 than Natural, simply by examining font size.  Even without knowing exactly how many Java projects are in the QSM database, you can still determine that it's more than Visual Basic, but less than COBOL. 

Unsurprisingly, COBOL still has a large market share in the QSM database.  Most COBOL projects completed after 2000 were maintenance projects, not new development. 

Blog Post Categories 
SLIM-Metrics Languages QSM Database

Data is the New Soil

David McCandless gave a TED talk  in July 2010 that focused on pairing data and design to help visualize patterns.  In his talk, McCandless takes subsets of data (Facebook status updates, spending, global media panic, etc.) and creates diagrams which expose interesting patterns and trends that you wouldn't think would exist.  Although the focus of McCandless' talk was about how to effectively use design to present complex information in a simple way, I was struck by his own claim that data is not the new oil, but rather that data is the new soil.  For QSM, this is certainly true!

QSM maintains a database of over 10,000 projects with which we are able to grow a jungle of ideas, from trend lines to queries about which programming languages result in the highest PIs.  With  the amount of soil that we have, we are able to provide insight into the world of software, just with the data that is graciously provided by our clients.  By collecting your own historical data in SLIM-DataManager, you can create your own trend lines in SLIM-Metrics to use in SLIM-Estimate and SLIM-Control, analyze your own data in SLIM-Metrics, tune your defect category percentages and calculate your own PI based on experience in SLIM-Estimate, and much, much more. 

An In-Depth Look at the QSM Database

The QSM Database is the cornerstone of our tools and services, so our clients and prospects often ask for more information regarding the data and types of projects represented. This blog post addresses some frequently asked questions about the QSM Database.

Sources of Data

Since 1978, QSM has collected completed project data from licensed SLIM-Suite® users and trained QSM consulting staff. Consulting data is also collected by permission during productivity assessment, benchmark, software estimation, project audit, and cost-to-complete engagements. Many projects in our database are subject to non-disclosure agreements but regardless of whether formal agreements are in place, it is our policy to guard the confidentiality and identity of clients who contribute project data. For this reason, QSM releases industry data in summary form to preclude identification of individual projects/companies or disclosure of sensitive business information.

Data Metrics

Our basic metric set focuses on size, time, effort, and defects (SEI Core Metrics) for the Feasibility, Requirements/Design, Code/Test, and Maintenance phases. These core measurements are supplemented by nearly 300 other quantitative and qualitative metrics. Approximately 98% of our projects have time and effort data for the Code and Test phase and 70% have time/effort data for both the R&D and C&T phases.

Productivity is captured via the following metrics:

QSM Productivity Index (PI)
Cost per SLOC or Function Point
SLOC or Function Points per month
SLOC or Function Points per Effort Unit (Months, Hours, Days, Weeks, Years)

Quality data is captured via the following metrics:

Blog Post Categories 
Metrics QSM Database