Data

Data

Circa 2021, What Does a “Typical” Software Project Look Like?

Background

No two software projects are exactly alike. So, one way to find out what a “typical” software project looks like is to take a large sample of completed projects from the QSM historical database of over 13,000 completed software projects and look at measurements of central tendency for staff, effort, size, schedule duration, and productivity.

For this study, QSM looked at validated projects that completed beginning in 2010. We eliminated 1 person projects and those that expended less than 1 person month of effort. The eliminated projects accounted for 13% of the sample. About 80% of the projects fell into the Business IT application domain, many of which were from the financial services sector. This domain includes projects that typically automate common business functions such as payroll, financial transactions, personnel, order entry, inventory management, materials handling, warranty and maintenance products. We determined both a median and an average for each metric. With the exception of schedule (project duration), these differed significantly which indicates that that the sample metric values were not normally distributed. To minimize the effect of unrepresentative projects (those that comprise a small part of the sample, but whose metric values are very large or very small), we decided to use the medians – values with 50% of the projects above and 50% below the “average” as a better measure of central tendency.

The "Typical" Project

Metric

Median

Average Staff (Full Time Equivalent)

4.87

Data Analytics for Project and Portfolio Estimates

We live in a multi-dimensional world.  We see in three dimensions.  Our brains’ ability to process spatial relations of height, width, and depth are essential for navigating everywhere we go and every task we perform.  The scientific world has used computers and data to generate 3D graphics for years, because it is the only way to understand complex phenomenon and ideas.  I remember the first 3D color seismic map of rock formations underground I saw.  The image told a story the numbers alone could not.  The business world has caught on in recent years.  The wave began with data warehousing and business intelligence and has grown to include data analytics, artificial intelligence, and machine learning.

QSM has brought a scientific approach to software development project estimation and management for over 40 years.  Our SLIM-Suite of tools contain statistics on the largest repository of completed software projects that enable you to model software projects to predict potential outcomes and assess the reasonableness of your estimates and project goals.  They have always provided four common types of Data Analytics1 – Descriptive, Diagnostic, Predictive, and Prescriptive.  SLIM tools now provide more in-depth data analytics using quadrant charts.

Software Project Risk Trend Variance Analysis

Blog Post Categories 
Estimation Data

How Can You Leverage Big Data to Reduce Your IT Costs?

Today more than ever we have access to large amounts of information. You've probably heard the term "big data," which in essence is having access to large amounts of data and examining the trends in that data. But many executives want to know how they can leverage this information to solve business problems, like lowering IT costs. One way is to use the data to do a better job of estimating IT projects.

Better estimating helps avoid signing up to schedules and budgets that are unrealistic; it helps avoid overstaffing a project or a portfolio of projects; and it helps calculate how much work can be completed within project constraints. In addition, it improves communication internally across the enterprise and externally between the vendor and the client. You can apply estimation to in-house projects and you can use it to generate better proposals or to do a better job of evaluating proposals.  It can also help you negotiate more effectively.

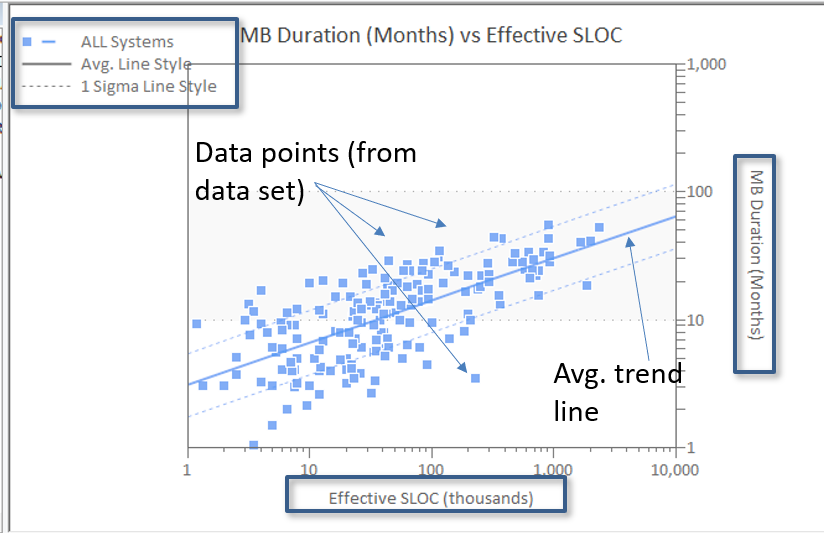
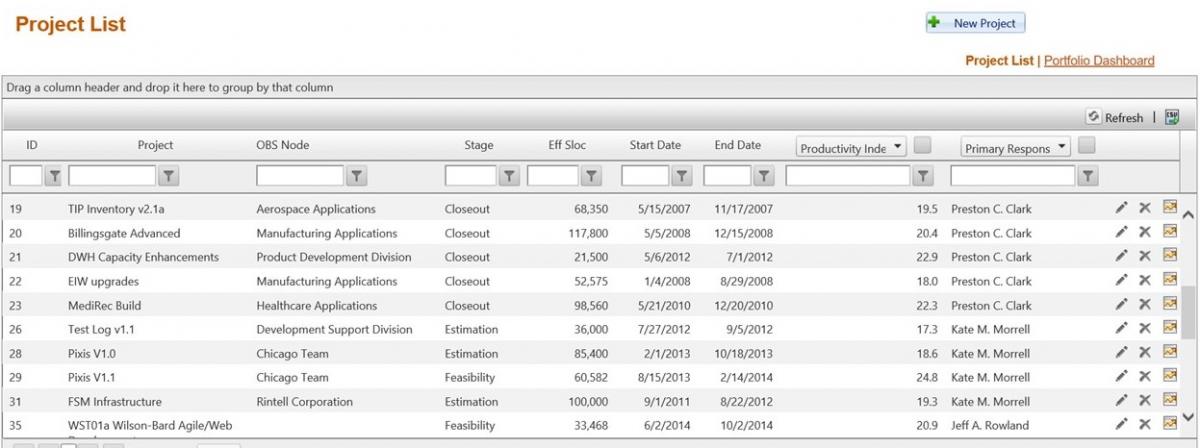
To do a better job of estimating, you need to make good decisions regarding which metrics to leverage. You might have thousands of data points, but it's important to streamline the focus to the core release level metrics: cost, duration, effort, reliability, and productivity.  Next, you need to find a centralized place to organize and store the data so you can analyze it. There are tools out there that can help you. In the view below, you can see a portfolio of projects stored in a centralized place with the ability to manage the access and security.

Big Data to Reduce IT Costs

Blog Post Categories 
Data IT Budgeting Estimation

New Article: Leveraging the Power of Historical Data Through the Use of Trend Lines

Size vs. Staffing

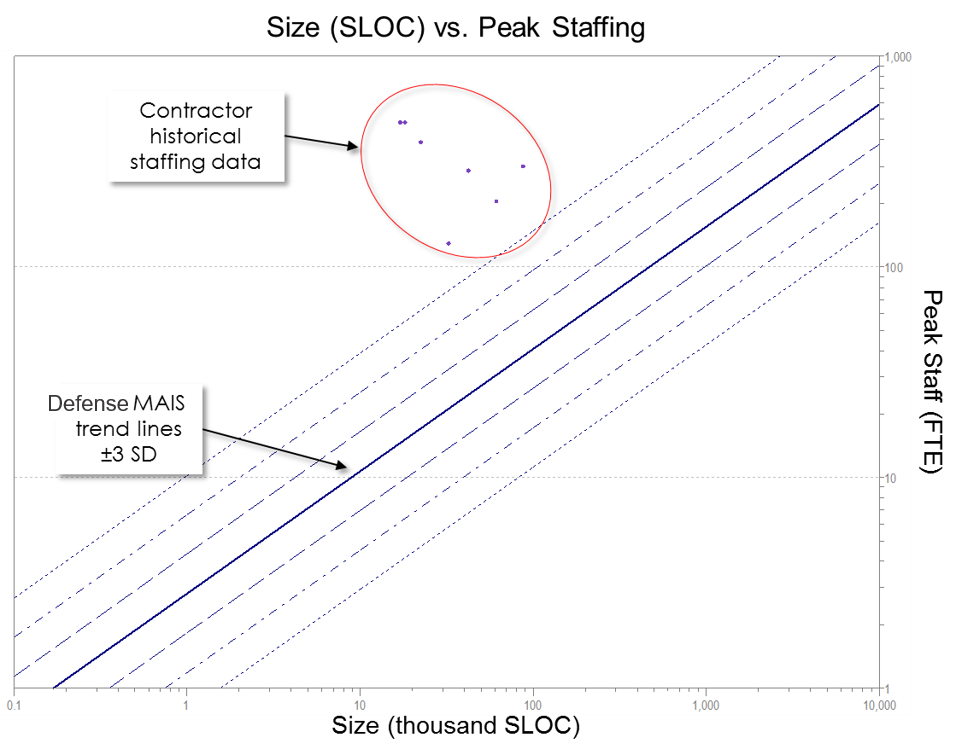
Developing software within the DoD presents a unique set of challenges, including but not limited to budget cuts, Congressionally mandated changes, changing software requirements, and so on. It should come as no surprise, therefore, that cost estimators have faced significant challenges when estimating systems in the Defense arena. A recent initiative put forth by the DoD was to improve its estimation process by leveraging historical data collected from forensic analyses of recently completed software development efforts. This article by Taylor Putnam-Majarian and John Staiger, discusses (1) some of the challenges faced throughout this initiative, (2) the data collection process, and (3) how one can leverage data to improve cost estimates. This article was originally published in Crosstalk Magazine.

Read the article!

Blog Post Categories 
Articles Data Database Estimation Government

Historical Data Isn’t Playing "Hard to Get"

Historical Data Collection

“No, we don’t have any historical project data collected” is the statement I hear with some frequency when speaking to organizations about their IT project estimating processes.  Ideally we use client history to calibrate and tune the project estimates we provide.  In my quest to spread the word about parametric estimating I often encounter this notion that organizations don’t believe they have historical data in a retrievable form.  In almost every case that I have been involved, it turned out that the historical data was present, just not in the form of a 1,000 rowed spreadsheet.  Often times the data is more available than the client is aware.

Our approach works at a macro level so we are seeking overall project metrics of cost, schedule, size, staffing and defects.  If the actual formal documentation of history is not available for these five core metrics, then it usually is available by leveraging various sources within the organization.  We have found it’s common to resurrect a project’s outcome by seeking feedback from the team that worked the project, however if that’s not possible due to attrition, re-org or other disrupting factors, we can usually find the project metrics through other means.  Those other means may be time and defect tracking tools, requirements analysis tools and accounting systems.  The data is almost always documented somewhere.   

Blog Post Categories 
Database Data Metrics

Why Should I Care about the Actual Data? The Project Is Complete.

"The game ain't over 'til it's over." - Yogi Berra

Baseball season is here and with apologies to the late Mr. Yogi Berra, “it’s like déjà vu all over again.”

Why would a project team or program management office (PMO) take the time and spend the resources to collect information about a project that was just completed? Isn’t this the time when victory is declared and everyone runs for the hills? In many cases, delving into what happened and what actual costs and durations were incurred can seem like an exercise in self-flagellation.

Historical data is arguably the most valuable input available in the software estimation process. While other inputs such as size and available duration or staffing can be seen as constraints, properly collected historical data moves the activity from the realm of estimating closer to “factimating.”

Blog Post Categories 
Data SLIM Suite

Cut the 'Madness' Out of Software Estimation

The time has come, once again for QSM’s annual March Madness tournament.  As we enter our 6th year of friendly office competition, I looked back at some of my previous strategies to help me figure out how I wanted to go about completing my bracket this year.  In doing this, I realized that many of these concepts can be applied towards IT project management.

Three years ago, I built my bracket around an emotional desire for my preferred team to win.  I paid very little attention to their previous performance that season, or any of the other teams for that matter.  Needless to say, I did not do as well as I had hoped that year.  Unfortunately, this strategy is applied fairly frequently in software estimation, with stakeholders committing their teams to unreasonable schedules and budgets for projects that are “too big to fail.”  Committing to a plan based off of the desired outcome does not produce a good estimate, and often results in cost overruns and schedule delays (or in my case, quite a bit of ridicule from the Commish).

Blog Post Categories 
Data Estimation Risk Management

Probability, Baseball, and Project Estimation

How is baseball analysis like software project management?  One way is the ability to continually update estimates and forecasts, as the situation and our knowledge change.  As Larry Putnam Jr recently wrote, “project estimation should continue throughout the entire project lifecycle”. 

Walter Shewhart, the father of Statistical Process Control, explained it like this:

“…since we can make operationally verifiable predictions only in terms of future observations, it follows that with the acquisition of new data, not only may the magnitudes involved in any prediction change, but also our grounds for belief in it.”

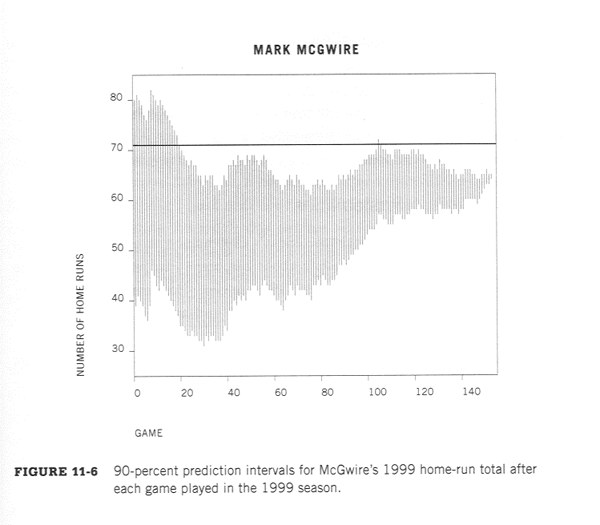
Here is a baseball example that should appear very familiar to software estimators who are familiar with the often quoted cone of uncertainty.  The following graph is taken from Curve Ball: Baseball, Statistics, and the Role of Chance in the Game, by Jim Albert and Jay Bennett.

Baseball Software Project Probability

The above model is based upon only a few simple items:  The number of homeruns hit so far; the number of games played so far and number remaining; and the total number of games in a season.  We could try to improve the model, especially early in the season, by incorporating more information.  For example:  

Blog Post Categories 
Estimation Data Project Management

A Case of Software Data Collection

Software Data CollectionTelevision has done a fine job of glamorizing the job of an investigator.  Whether you fancy the classic Sherlock Holmes, the affable Colombo, or even perhaps enjoy the suspense associated with cracking the case on television shows like “The First 48,” Hollywood has tried to make us believe the search for clues is always exciting.  However, those who have searched thousand row spreadsheets for software data collection efforts, may beg to differ with that sentiment.  The needle in a haystack analogy may seem more fitting, if only the haystack was bigger!
Although most folks will never get the chance to track down a villain like Sherlock’s nemesis, Professor Moriarty, there still is a need in many professions to find “clues.”  In software estimation, those clues can be thought of as software project data. What information do I need to solve this software project estimation case and how do I obtain it? In that search for information, perhaps we can utilize some basic investigation steps to find the software data needed to produce good software project estimates. Honestly, why would one embark on the often daunting quest of collecting project data for future estimation without at least a basic approach?  Well, there are many reasons.  However, let’s focus on a way to proactively look at an approach using the analogy of an investigation.

Blog Post Categories 
Data

Data-Less Decision Making

I rather enjoyed the Google Analytics April Fools prank earlier this month, Welcome to Data-Less Decision Making on Analytics Academy.  Though satirical, this video brings to light an important reason why individuals have such trouble making decisions in a business environment: they don’t have data.

I’ll agree that without data it’s really appealing to turn to the coin flip method and be done with it.  After all, 50/50 odds really aren’t terrible, right?  But project management software such as SLIM-Estimate make empirically-based business decisions possible, even when company data isn’t immediately available.

Leveraging our database that contains over 10,000 projects, QSM has developed and regularly updates 17 distinct industry trends.  When creating an estimate or benchmarking a past performance, simply select the QSM industry trend that most closely reflects the type of system being built.  This will serve as a reference point.

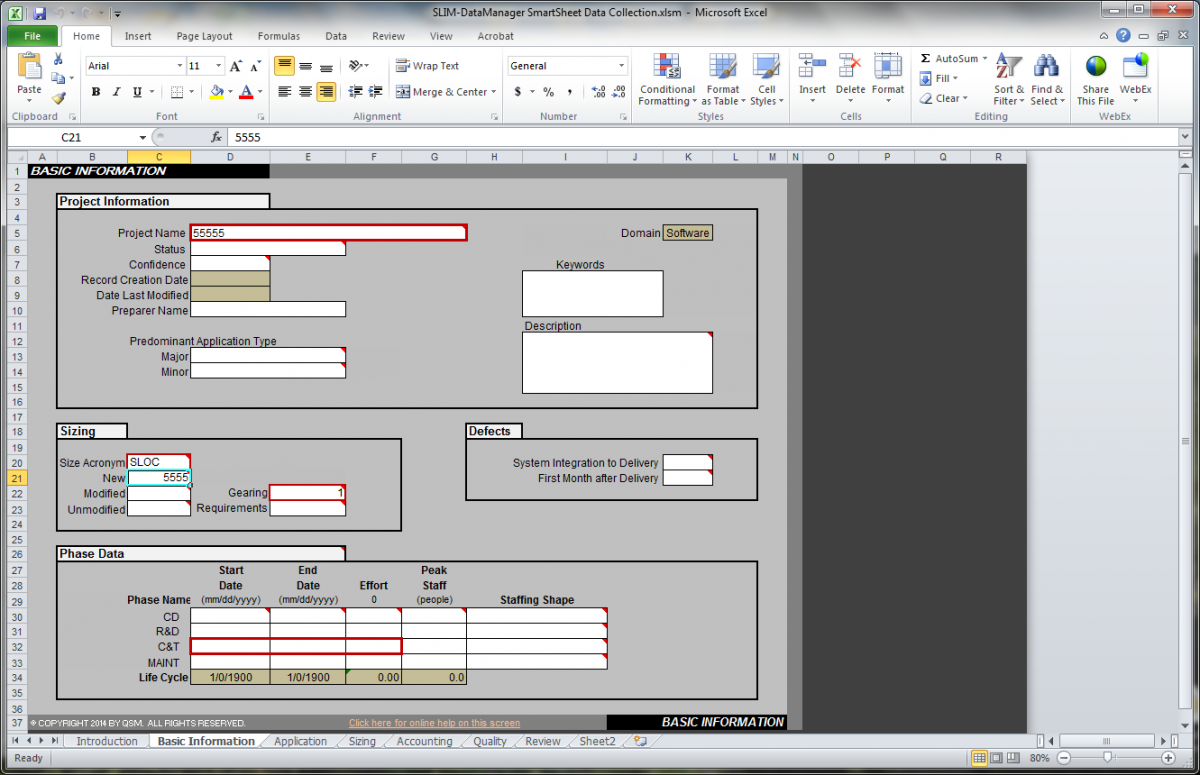
If historical data is available but you’re unsure of which metrics to collect, SLIM-SmartSheets is a new downloadable feature in SLIM version 8.2 that mimics the look and feel of SLIM-DataManager and allows users to collect project data, even when they’re not on a network computer.  Each project can then be pulled into one SLIM-DataManager file using the API.  

SLIM-SmartSheets