Practical Software Estimation Measurement

Blogs

QSM Announces Latest Update to the QSM Project Database

We are pleased to announce the the latest update to the QSM Project Database! The 8th edition of this database includes more than 10,000 completed real-time, engineering and IT projects from 19 different industry sectors.

The QSM Database is the cornerstone of our business. We leverage this project intelligence to keep our products current with the latest tools and methods, to support our consulting services, to inform our customers as they move into new areas, and to develop better predictive algorithms. It ensures that the SLIM Suite of tools is providing customers with the best intelligence to identify and mitigate risk and efficiently estimate project scope, leading to projects that are delivered on-time and on-budget. In addition, the database supports our benchmarking services, allowing QSM clients to quickly see how they compare with the latest industry trends.

To learn more about the project data included in our latest update, visit the QSM Database page.

Blog Post Categories 
QSM Database

New Article: Data-Driven Estimation, Management Lead to High Quality

Software projects devote enormous amounts of time and money to quality assurance. It's a difficult task, considering most QA work is remedial in nature - it can correct problems that arise long before the requirements are complete or the first line of code has been written, but has little chance of preventing defects from being created in the first place. By the time the first bugs are discovered, many projects are already locked into a fixed scope, staffing, and schedule that do not account for the complex and nonlinear relationships between size, effort, and defects. 

At this point, these projects are doomed to fail, but disasters like these can be avoided. When armed with the right information, managers can graphically demonstrate the tradeoffs between time to market, cost, and quality, and negotiate achievable deadlines and budgets that reflect their management goals. 

Leveraging historical data from the QSM Database, QSM Research Director Kate Armel equips professionals with a replicable, data-driven framework for future project decision-making in an article recently published in Software Quality Professional

Read the full article here.

Blog Post Categories 
Articles Data Quality

Let's Get Serious About Productivity

Recently I conducted a study on projects sized in function points that covers projects put into production from 1990 to the present, with a focus on ones completed since 2000. For an analyst like myself, one of the fun things about a study like this is that you can identify trends and then consider possible explanations for why they are occurring. A notable trend from this study of over 2000 projects is that productivity, whether measured in function points per person month (FP/PM) or hours per function point, is about half of what it was in the 1990 to 1994 time frame.

Median Productivity

 1990-19941995-19992000-20042005+
FP/PM11.1179.215.84
FP/Mth17.163.929.7422.10
PI15.316.413.910.95
Size (FP)394167205144


Part of this decline can be attributed to a sustained decrease in average project size over time. The overhead on small projects just doesn’t scale to their size, thus they are inherently less productive. Technology has changed, too. But, aren’t the tools and software languages of today more powerful than they were 25 years ago?

Blog Post Categories 
Productivity Project Management

They Just Don't Make Software Like They Used to… Or do they?

With the release of SLIM-Suite 8.1 quickly approaching, I thought I’d take a moment to share a preview of the updated QSM Default Trend Lines and how it affects your estimates.  In this post I wanted to focus on the differences in quality and reliability between 2010 and 2013 for the projects in our database.  Since our last database update, we’ve included over 200 new projects in our trend groups.

Here are the breakouts of the percent increases in the number of projects by Application Type:

  • Business Systems: 14%
  • Engineering Systems: 63%
  • Real Time Systems: 144%

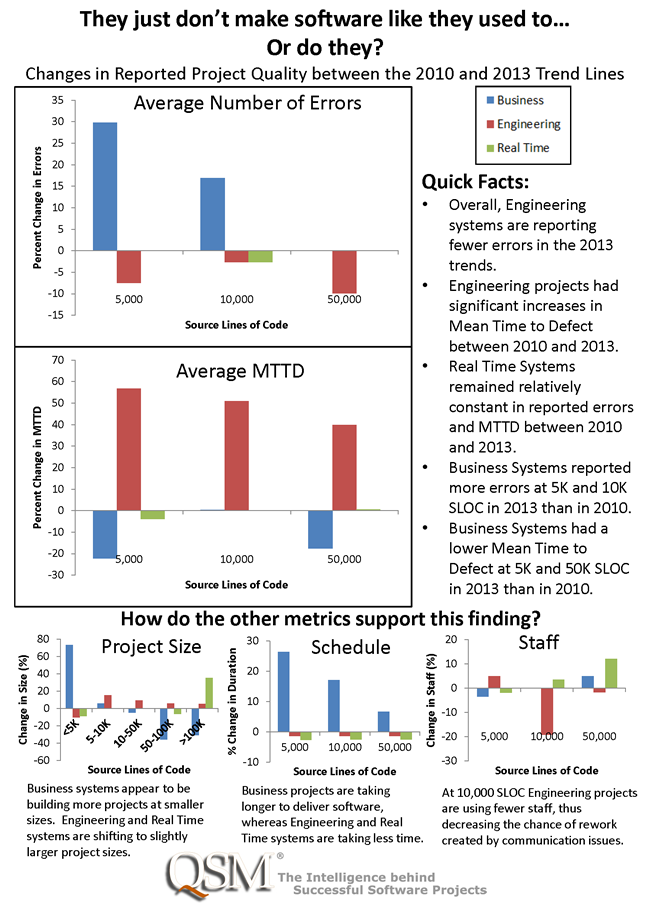
Below you will find an infographic outlining some of the differences in quality between 2010 and 2013.

Changes in Software Project Quality between 2010 and 2013

From the set of charts above, we can see some trends emerging which could indicate the changes in quality between 2010 and 2013.  By looking at the data, it’s apparent that two distinct stories are being told:

1. The Quality of Engineering Systems has Increased

Blog Post Categories 
Software Reliability Quality

Updated Function Point Gearing Factor Table

Version 5.0 of the QSM's Function Point Gearing Factor table is live!

The Function Point Gearing Factor table provides average, median, minimum, and maximum gearing factors for recently completed function point projects. A gearing factor is the average number of basic work units in your chosen function unit. Originally, it was designed to be used as a common reference point for comparing different sizing metrics by mapping them to the smallest sizing unit common to all software projects. QSM recommends that organizations collect both code counts and final function point counts for completed software projects and use this data for estimates. Where there is no completed project data available for estimation, we provide customers with a starting point to help them choose an appropriate gearing factor for their chosen programming language.

For this version of the table, we looked at 2192 recently completed function point projects out of the 10,000+ in QSM's historical database. The sample included 126 different languages, 37 of which had enough data to be included in the table. Interestingly, this year we added three new languages: Brio, Cognos Impromptu Scripts, and Cross Systems Products (CSP).

One trend we noticed is that, in general, the range for gearing factors has decreased over time. Similarly, the average and median values have decreased, which we attribute to having more data to work with.

Read the full press release or visit the new table!

Blog Post Categories 
QSM News Function Points

QSM Partners with Digital Celerity for CA World 2013

We are pleased to announce QSM's partnership with Digital Celerity LLC, a leader in Project and Portfolio Management (PPM) and IT Service Management expert services and solutions, for CA World 2013

At the event, representatives from both QSM and Digital Celerity will showcase how QSM's SLIM Suite of Tools feeds project estimation data into the CA ClarityTM PPM tool to allow for improved planning and resource allocation. Out of the top 10 systems integrators in the world, seven rely on SLIM intelligence. By engaging in this type of top-down estimating, analytics for project planning can be fed into PPM tools such as CA ClarityTM PPM. Resulting analytics include detailed plans for effort by labor category, time period and project size. Leveraging SLIM tools with CA ClarityTM PPM pushes project risk identification to the earlier proposal and feasibility stages in the project lifecycle, which can significantly reduce the risk of project failure. 

The conference, which takes place April 21-24, 2013 in Las Vegas, NV, will showcase the latest and most innovative technologies for delivering optimal business results. Stop by QSM booth #115 to learn more about how SLIM enhances PPM tools.

For more details about this partnership, read the full press release.

Blog Post Categories 
QSM News

Estimating for the Business Plan

Having worked in sales and customer service at QSM for over 17 years, I speak to hundreds of professionals each year that are directly or indirectly involved with software development projects using many different development processes. One of the things that I hear from time to time is that estimating is not as important when working with more iterative development methodologies. Some of the reasons I hear most often are that “team sizes are smaller,” “work can be deferred until the next iteration,” “we are different,” and “we are agile.”

As I dig deeper though, I find that the fundamental questions that software estimates answer are relevant, no matter what development methodology is being used. Before committing to a project, executives and managers need to determine reasonable cost, schedule, and how much they can deliver. This is when not very much is known and before any detailed planning occurs.  Estimating helps mitigate risk early in the project lifecycle. Companies also need to have reliable information in order to negotiate with clients. How can we negotiate a schedule and a budget on any project without a defensible estimate? 

When looking at QSM research based on our database of over 10,000 industry projects, a common theme that we see in failed projects is that development team performance is often not the issue. When it comes to missed schedules and budgets, many of the problems occur when expectations are too high and when estimates are not a priority. If we don’t have a reliable estimate up front before the project starts, it’s tough to plan ahead. 

Blog Post Categories 
Estimation

Haste Is Expensive

Large companies often seem to have a few people in key positions with extra time on their hands. Occasionally, this time is used to invent acronyms that are supposed to embody corporate ideals. Mercifully, these usually fade away in time. A former employer of mine had two beauties: LOCOPRO (Low Cost Provider) and BEGOR (Best Guaranteer of Results). Unfortunately, besides being grating on the ear, LOCOPRO and BEGOR don’t always march in tandem. LOCOPRO deals with cost and the effort required to deliver something. BEGOR is a bit more amorphous dealing with quality and an organization’s efficiency and consistency in meeting requirements.

What are the normal requirements for a software project? Here’s my short list.

  • Cost. What is being created and delivered has to be worth the expense in the mind of the person or organization that is funding it. (LOCOPRO is good)
  • Schedule. The timeframe in which a project creates and delivers its software is frequently a key constraint. Meeting this is important. Consistency and predictability (BEGOR are good)
  • Quality. In Business IT systems this is often an implicit requirement that is most noticed when it is absent. Real time, telecommunications, military, and life support systems are more frequently developed and tested to explicit quality standards.

The mantra of Faster/Better/Cheaper captures most organizations’ desires for Cost, Schedule, and Quality – all at the same time. If only the laws of software would cooperate! But they don’t. Software is like a balloon. You constrict it in one place (schedule, for instance) and it expands in another (cost). The problem isn’t going to disappear; but by prioritizing requirements, conscious and realistic tradeoffs can be made.

Blog Post Categories 
Schedule

Ditch the Madness: SLIM Your Brackets

Monday morning I received an email that read:

Hi All,
You can set your clocks to it: the birds flying north for spring, daylight savings time, and this email being sent on the Sunday before the tournament begins.  That's right, March Madness is upon us my friends, and we’ve officially made it through winter. 

The message continued with details about how to participate, but as you can see, it’s time for QSM’s annual March Madness tournament.  So how do I justify spending company time filling out brackets?  By blogging about how this is actually related to project management.  As I went through the exercise of predicting the course of this tournament, I realized that many of the thoughts I had also go through the minds of project managers.

Before I reveal my picks I want to give some background information.  I’m new to this whole March Madness tournament thing.  I’m not familiar with the teams.  I don’t know the players’ strengths and weaknesses.  I didn’t watch their games earlier in the season, so I don’t know their stats.  All I know is that my significant other went to Ohio State so I want them to win.

Blog Post Categories 
SLIM-Estimate Project Management

Velocity: What Is It?

It’s easy to get confused or overly concerned about measuring velocity. Actually, the concept is almost embarrassingly simple. Velocity in Agile is simply the number of units of work completed in a certain interval. Like in many fields, Agile proponents appropriated existing terminology.

Here is one typical definition, from agilesoftwaredevelopment.com:

In Scrum, Velocity is how much product backlog effort a team can handle in one Sprint. Velocity is usually measured in story points or ideal days per Sprint… This way, if the team delivered software for 30 story points in the last Sprint their Velocity is 30.

Velocity as a capacity planning tool used in Agile software development is calculated from the results of several completed sprints. This velocity is then used in planning future sprints.

The concept of velocity comes from physics. In physics, velocity is speed and direction, in other words, the rate of change of position of an object. Speed can be measured in many different ways.

In software, speed is frequently measured as size per unit of time (sometimes this has been called delivery rate). The measure of size could be any of the common size measures: lines of code, function points, requirements, changes, use cases, story points. The measure of time could be calendar time (month, week, day) or it could be specific to a project (sprint, release). As to direction, in software hopefully the direction is positive, but sometimes projects go backwards (for example, backing functionality out of a system).

Blog Post Categories 
Sizing Agile