Often within technology organizations there is a general belief that increasing staff increases the amount of production. But what if there were better options? Wouldn’t it be great to see some additional management options using predictive analytics? This type of analysis could save organizations millions of dollars by showing how to hit their goals by just planning more effectively.
Where do you start? First, we recommend centralizing your project data so your information can be easily accessed. These projects can be completed, in-progress, or getting ready to start. The best way to do this is with a tool that lets you store the data and that also lets you generate the forecasts, all in one convenient place.
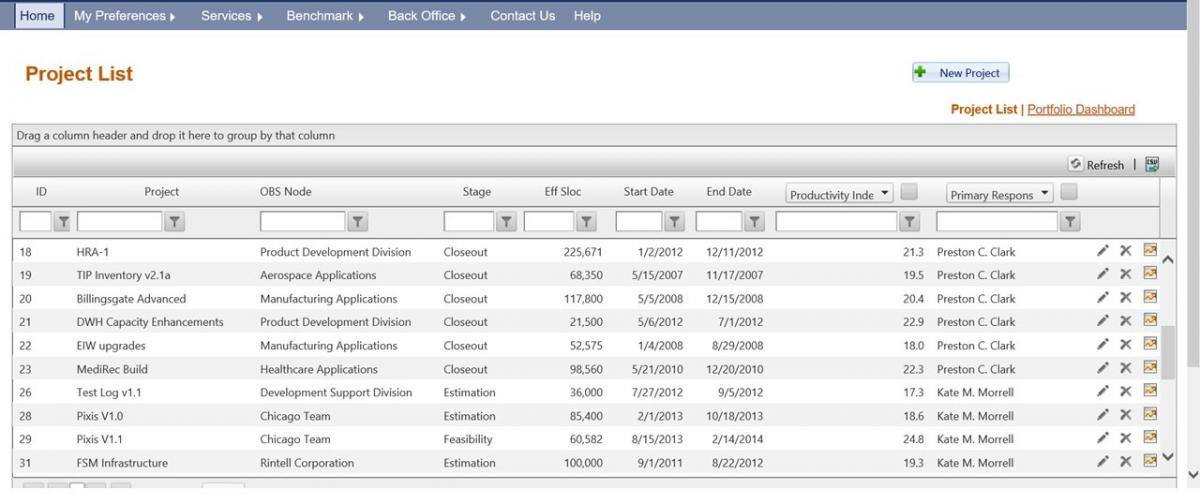
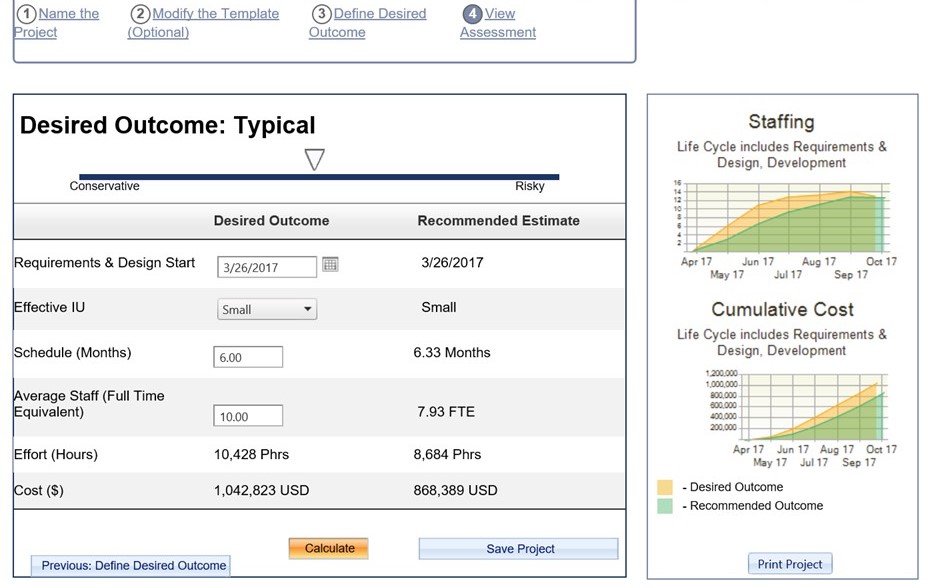
The next step would be to run built-in forecasting models to see if you can complete the required amount of work with the existing number of resources. These models also provide other options to consider, like adjusting the number of resources on a software release or extending a project schedule to save money. The best models are empirically-based and time-tested. To generate the analysis, you need to enter some basic project level goals and the models then leverage historical data to forecast a reliable duration, effort, cost, and staffing assessment for each release.
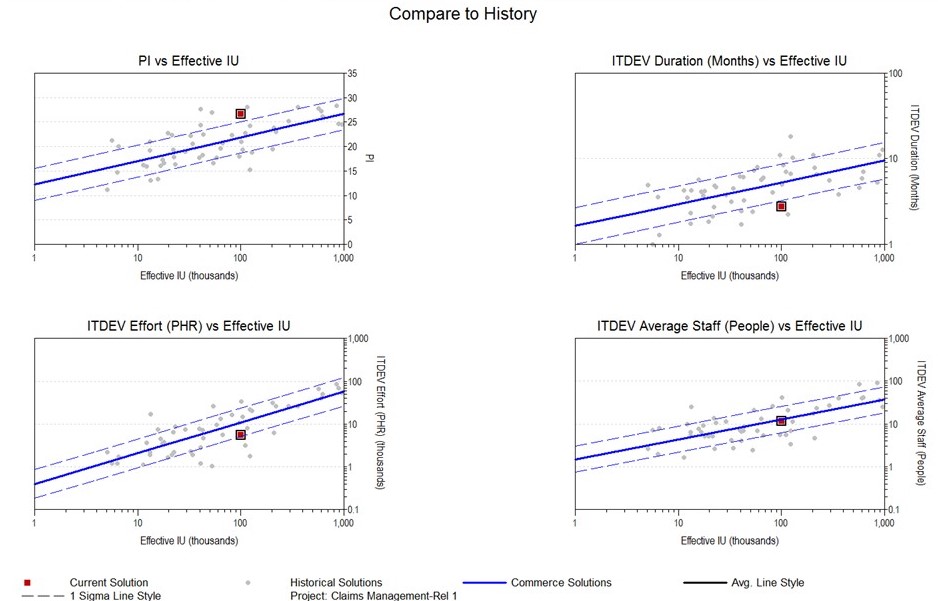
We call these early forecasts or feasibility estimates, and they can be quickly sanity-checked with industry trends to make sure you are on the right path before committing. You can see in the chart below that the software project estimates are represented by the red data points and compared to the blue industry trends from the QSM Industry Database. The estimates are also compared to the client history represented by the gray data points. This analysis lets you see if your average staff and productivity is competitive with the industry. Productivity is represented on one of the charts by the PI, also known as the Productivity Index: the empirically-driven measure from the Putnam (SLIM) Model.
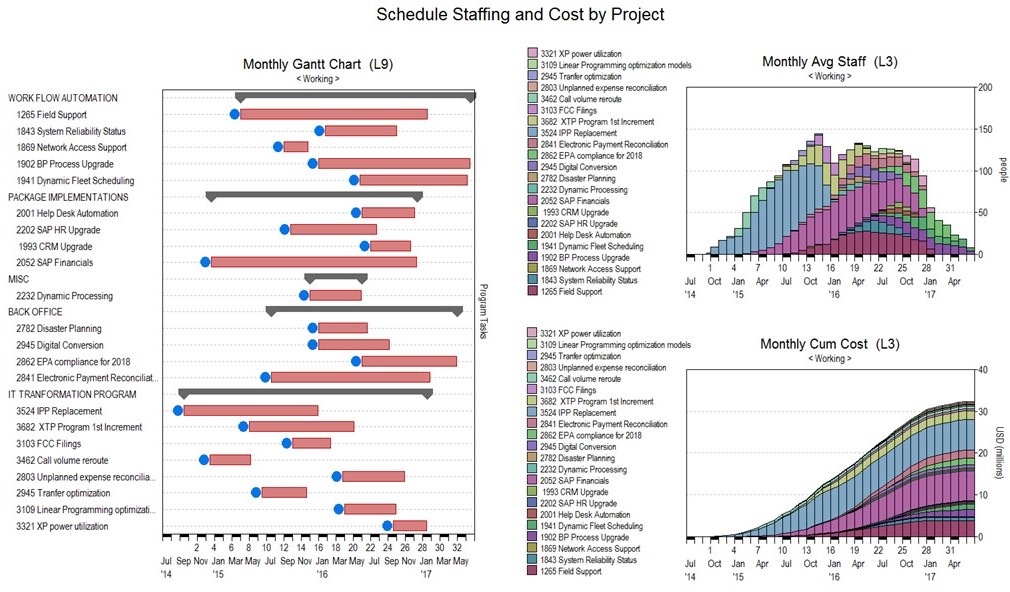
Once you have a handle on these early estimates you can then refine your estimates with additional data and look at the interdependencies of these projects at an organizational level to see your enterprise budget. Below you can see a portfolio of projects in one convenient view with duration, cost, and staff information.
This type of analysis will show you when specific projects are in trouble and when they could negatively impact the overall IT budget. By seeing this information early, you can react to it and plan accordingly. In the bubble charts below, you can see which projects are outside the green so you can begin to re-plan and start moving them back into the comfort zone.
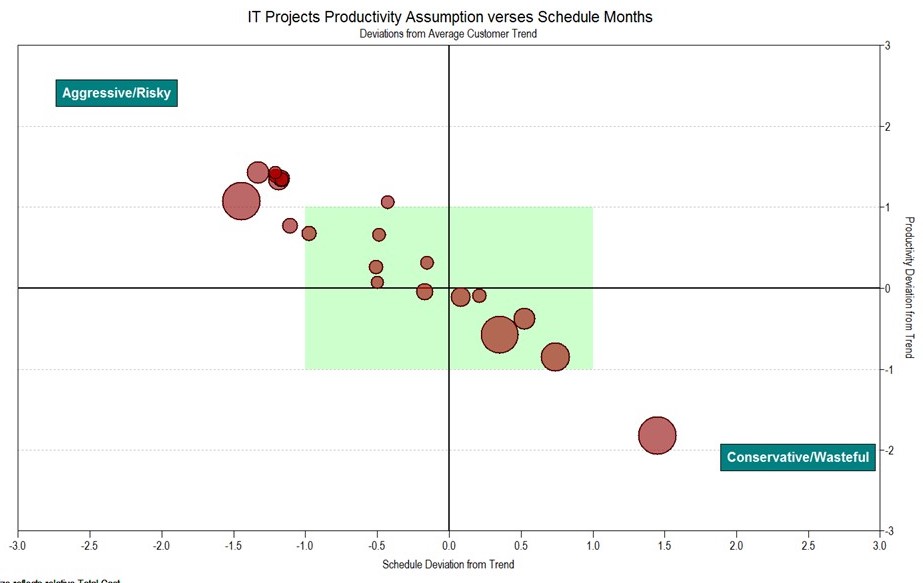
By looking at the project and portfolio forecasts, you can determine early in your budgeting cycle whether you can leverage existing experienced staff or whether you need to hire more people. If you need to hire, the forecasts can show you the ideal peak staff and where to allocate your resources. You might reach the conclusion that some projects are projected to be overstaffed with unrealistic schedule constraints and that resources can be reassigned to other projects, potentially saving your organization big money.
