Is your agile team’s velocity constant from sprint to sprint? No? That’s not a surprise. Many teams assume that their velocity will be constant. In this article, we’ll see why that’s not the right expectation and how that affects how you use this metric.
What Is Velocity?
Velocity measures the amount of work accomplished in your project over time. In agile terms, this is how much of your release’s backlog is completed in each iteration. Velocity is measured in whatever unit you use to estimate stories; for example, story points per iteration or the count of stories per iteration.
Teams often assume that their velocity will be nearly constant, although most teams know that the velocity in early iterations may be lower than later ones. Since all the sprints are the same duration, this amounts to assuming that the team will complete the same amount of the backlog in each iteration. However, that’s not the way real projects work! To see the significance of this, we need to look at how velocity is used.
Uses of Velocity
Teams use velocity in three ways:
- Iteration planning: How many stories should we plan for the next iteration? The assumption of constant velocity says we could plan the next iteration to match the previous one.
- Release planning: How many iterations should we plan for a new product release? Divide the total planned backlog by the velocity to find the number of iterations.
- Project forecasting: How many more iterations until we release? Divide the remaining backlog by the velocity and adjust the plan.
These simple techniques to accomplish difficult planning tasks make it really tempting to assume velocity will be constant. But just because that assumption is tempting doesn’t make it correct.
Velocity Is Not Constant
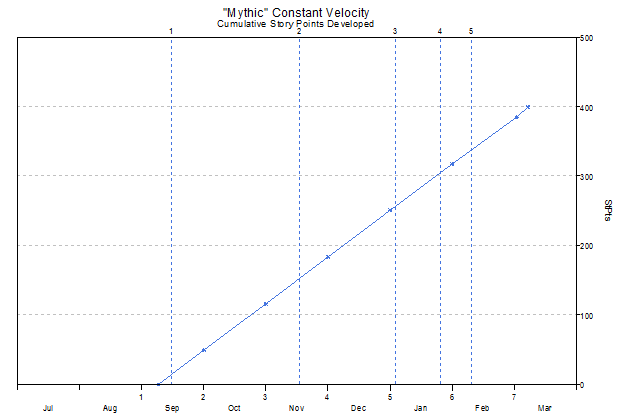
If velocity were constant throughout a project, the graph of the cumulative work completed over time would be a straight line:

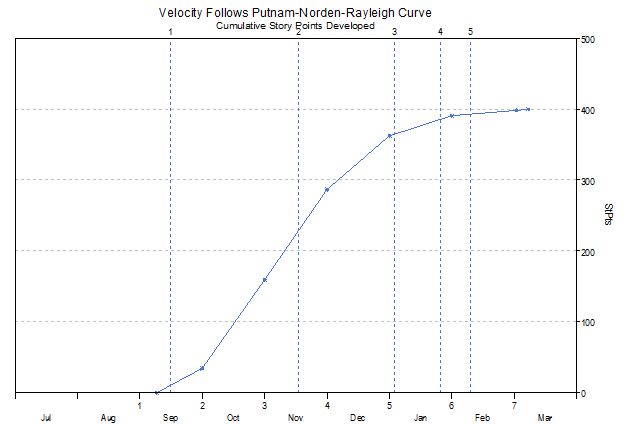
Years of research have shown, though, that key metrics--including the cumulative amount of work accomplished over time--follow an S-shaped curve, known as the cumulative Putnam-Norden-Rayleigh curve1,2,3. The reasons why projects take this shape vary. Different methodologies, including agile, have different characteristics that cause this production curve to change in detail. But while the reasons vary, the basic shape remains the same.

You can see this curve starts slowly, but then rises more steeply and flattens out at the end. Notice that in the middle of the release, the curve is fairly straight. This means that for a period of time, velocity will be close to constant but it will not stay constant. It will change later in the project when the curve flattens out again.
How can you use velocity even though it's not constant?
Let’s look at how the variability of velocity affects the three uses we pointed out earlier.
Iteration planning: Velocity doesn’t change abruptly. If you choose to estimate how many story points you plan to develop in an iteration based on what you developed in the last few iterations, you can still do that with some confidence. If you can determine where you are on the S-curve, you can polish that prediction. Are you near the bottom of the S, so the velocity will increase? Are you in the middle, so you expect the velocity to be about the same as the previous iteration? Or are you nearing the top of the S, so you should plan for a lower velocity?
Note that many agile coaches are wary of using velocity as a strong predictor of what you should estimate for the next iteration. Instead, you should look at the tasks required to develop the chosen set of stories to decide what you can commit to for the next iteration.4 This is the case whether you assume constant velocity or not.
Release planning: Whether you assume velocity is constant or not, using velocity to plan a new release is difficult. Velocity is a measure of what one particular team is doing on one particular release. There are several reasons velocity is often team and release dependent:
- Team sizes vary among projects, but velocity is not proportional. It’s not a surprise that a larger team accomplishes more than a smaller team in the same period of time, but it may surprise you that that how much more is quite difficult to compute. Doubling the team size does not double the velocity. So you cannot easily compare velocities of teams of different sizes.
- The team composition (both the experience of the team members as well as the team dynamics) affects the velocity.
- The nature of the product affects the velocity. For example, you would not expect the same velocity for a team building an informational website and a team building a life-sustaining medical device.
- Velocity depends on how the team measures the stories in Story Points, and also the chosen sprint length. This may differ from team to team or even from project to project.
To use velocity for release planning, you need to take a number of steps:
- Gather historical information from as many previous projects as you can. Instead of using the velocity from a single project, use trends computed from multiple projects.
- Work with multiple teams to normalize the way teams measure the backlog in Story Points.5,6
- Use estimation tools or collect historical data to compute the “time/effort” tradeoff, and adjust expected velocity based on team size. Remember, it is definitely not linear--doubling the team size only increases velocity by a moderate amount.
- Use an estimation tool or otherwise adjust the release plan to account for the S-shape of the project.
Project Forecasting: Consider multiple metrics, not just velocity. For example, also consider the rate at which stories are defined using your “definition of ready”. In addition, consider the burndown rate, which measures how the backlog is changing. If you swap out equal size stories, the change may not have much effect on the delivery date. But if you consistently add in more or larger stories than you take out, or if you decide not to deliver stories already developed, your original estimate may need to be adjusted.
As with iteration planning, when you’re reforecasting and you use the average velocity you’ve achieved so far in the project, consider where you are on the S-curve.
More Research Is Needed
Projects follow the Putnam-Norden-Rayleigh cumulative S-curve whether they use agile methods or not; but the methods you use do affect the shape. At QSM, we have been collecting data from thousands of projects for many years. We are starting to get enough data from projects using agile methods to start drawing some conclusions, but more research is still needed in several areas. Here are some of the questions that require more research to answer:
- Does the “middle of the S” cover more of the project, so velocity is closer to constant than with other methods?
- How does the agile principle of “embrace change” affect velocity? Is there more or less variance in the middle of the S because of scope changes?
- How do refactoring and emergent design affect the shape? As project size increases and thus the eventual design must accommodate many diverse stories, does the amount of refactoring needed show up in the S-curve as a longer “tail”? Does size affect the overall productivity gains from agile methods because of increased refactoring?
- How does test-driven development affect the shape? Does continuous testing throughout the project shorten the tail, either because testing is spread, or because defects are removed early?
In Summary
It’s not realistic to expect velocity on an agile project to be constant. Depending on how you intend to use velocity, you must adjust your estimating methods by keeping in mind the natural cumulative S-curve of development metrics. Agile methods almost certainly have an effect on the detailed shape of that curve, but more research is needed to know precisely how. In the meantime, use historical data plus your knowledge of your individual teams and projects to get the best estimates you can.
References
- Wikipedia, Putnam-Norden-Rayleigh Curve
- Putnam, Lawrence H. and Myers, Ware, “Controlling Software Development”, IEEE Computer Society Press, 1996, ISBN 0-8186-7452-0
- Chelson, Coleman, Summerville, and Van Drew, “Rayleigh Curves—A Tutorial”, SCEA, June 2004
- Cohn, Mike, “Why I Don’t Use Story Points for Sprint Planning”
- Scaled Agile Framework, “Normalizing Story Point Estimation”
- Berner, Andy, “Is it Bigger Than a Breadbox? Getting Started with Release Estimation”
