Developing software within the Department of Defense (DoD) presents a unique set of challenges. The environment is such that many of the programs are unusually large, complex, and schedule-driven, and typically require several years to develop, field, and deploy. Often, they are maintained for over a decade, during which time several advancements in technology, unknown at the inception of the program, must be accommodated into the existing system. It should come as no surprise, therefore, that cost estimators have faced significant challenges when estimating systems in the defense arena.
The Quantitative Software Management (QSM) team has supported the DoD at a variety of levels, from program management offices to the Secretary of Defense. One such organization’s recent initiative was to improve its estimation process by leveraging historical data collected from forensic analyses of recently completed software development efforts. This article discusses (1) some of the challenges faced throughout this initiative, (2) the data collection process, and (3) how one can leverage data to improve cost estimates.
Challenges
The Spanish philosopher George Santayana is credited with the observation that “those who do not learn from the mistakes of history are doomed to repeat them.” This astute piece of wisdom has been paraphrased and quoted many times, but it is especially relevant in the DoD environment due to the unique challenges posed by the size and complexity of DoD systems. In order to learn from past mistakes, it is important to review the specific actions, assumptions, and information that were used and available. Thinking back to a completed project that was considered successful, what were some characteristics that allowed it to do well? Conversely, thinking back to a project that was considered less than optimal, what should have been done differently? This type of information is often readily available informally, but it isn’t often captured in a quantifiable form. Hence historical data should be collected in order to objectively assess processes and quantify actual performance.
Collecting historical data, however, can sometimes be a sensitive subject. It is not uncommon for government organizations to face some resistance during the initial phases of data collection. One of the main challenges faced is a fear of measurement. Stated simply, people do not want to be viewed, either by their peers or their superiors, as less than successful. Even when projects have performed well, some still believe that any data disclosed could potentially be used against them. If we are able to overcome this first challenge, we’re often faced with a second, which is that no data is available.
Finally, historical data can be — and often is within the DoD environment — competition-sensitive. These challenges are typically navigated by using data from third-party industry benchmarks of completed programs rather than the organization’s actual historical performance data. If better data is unavailable or confidential for contractual reasons, a subset of data from comparable projects is used in lieu of client data.
Before discussing the process of how historical data is collected, it is important to first discuss why this information should be collected in the first place. Historical data serves as the foundation for quantitative, data-driven estimating, tracking, and process improvement. First and foremost, collecting historical data promotes good record keeping. While data collection is often a standard practice among DoD systems, it is most often decentralized or not properly validated, making it difficult to find the exact piece of information needed without searching through multiple documents or having a very low confidence level attached to it. Consolidating historical data into one location with appropriate levels of protection for each program makes it easier and more efficient to reference this information later. Secondly, historical data can be used to baseline and benchmark other historical projects in order to determine which projects were completed successfully and which could have been improved. Finally, and very important for DoD “budgeteers,” historical data can be leveraged for producing defensible, quantitative estimates for future projects. The following sections will discuss each of these points in greater detail.
Collecting Historical Data
How does one go about collecting historical data? Beginning this process can be intimidating, especially if historical data has not previously been collected. In order to simplify the process, one should instead focus initially on collecting just a few key pieces of information, adding more detailed metrics to the repository later.
For each phase of development, the start and end dates are collected and the schedule duration is calculated. This is most often represented in months, but weeks are sometimes used if the project is especially short or if Agile development is used. Next, data on the effort expended is gathered. This is most often represented in person-hours or person-months (or man-month/staff-months). The peak number of staff working on the program is also recorded. The last necessary piece of information is project size. This is typically captured in the form of source lines of code, function points, business or technical requirements, Agile stories, or RICEFW objects. Together, these pieces of information can be used to examine the project holistically.
Where can the required data be found? When beginning the data collection process, it is important to identify potential data sources or artifacts. This part of the data collection process can be similar to an archaeological dig. There will be a lot of data and information, but not all of it will be relevant or useful. However, it is necessary to sort through all of it in order to determine which pieces are relevant and necessary. In some cases, data must be acquired indirectly or derived using the artifacts and information that is available, particularly if the primary data is missing, unavailable, of questionable confidence, or if confirmation of key metrics is needed. Typically, requirements documents contain some early sizing information, and code counts can be run at the end of the development effort to capture a more refined sizing measure. Software Resource Data Reports (SRDRs), Cost Analysis Requirements Descriptions (CARDs), Automated Cost Estimating Integrated Tools (ACEIT) files, and program briefings are all useful for collecting schedule and effort data. Moreover, if vendors are required to submit their data, Microsoft Project© files, Clarity©, and other PPM© exports can be additional valuable data sources to verify staffing, schedule, and effort.
It is beneficial to have multiple source options for obtaining information. Many of these documents will undergo several iterations and may be updated at each milestone of the acquisition life cycle. Unless the data appears questionable or invalid, it is usually best to use the data from the most recent version of the source document. Having multiple source options allows for validation, derivation of key metrics, and contextual information, all of which serve to maintain the integrity and increase the value of the historical performance database.
Putting Historical Data to Use
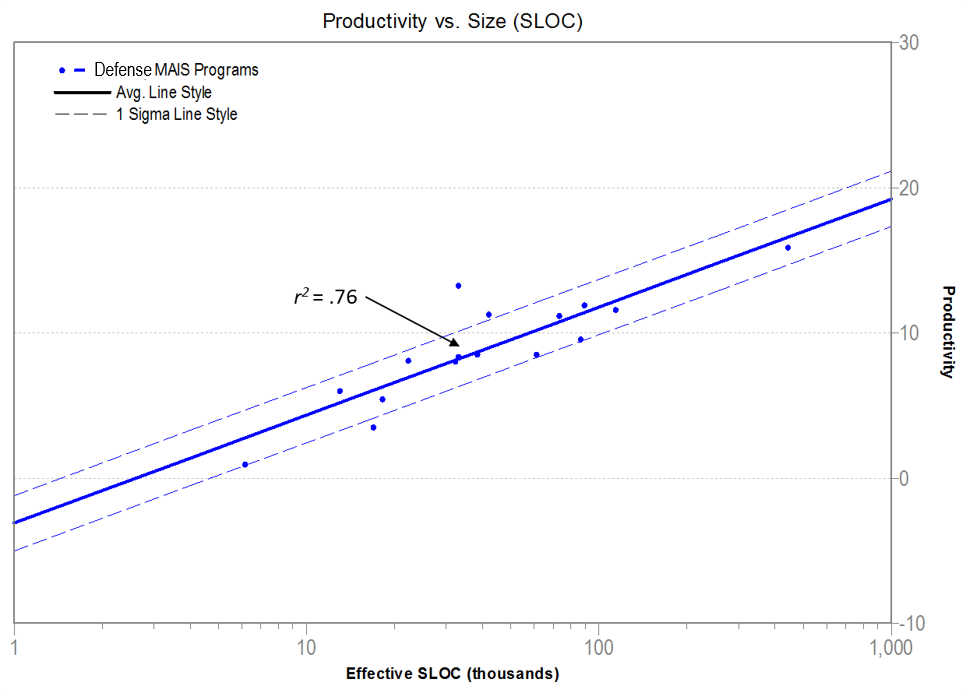
As an example, QSM’s support team went through the process of collecting and validating a set of data from recently completed Defense Major Automated Information System (MAIS) projects. Within the DoD, MAIS programs are those systems consisting of computer hardware, computer software, data, and/or telecommunications that perform functions such as collecting, processing, storing, transmitting, and displaying information. They are also above a specific cost threshold or designated as a special interest program. With this data set, the team was able to create a set of MAIS trend lines as shown below (see Figure 1).

Figure 1. Defense MAIS Productivity Trend Lines.
Although these 16 data points came from three distinct vendors, notice that the r2 value equals 0.76, indicating that the relationship between size and productivity for these releases was highly correlated. This type of correlation is typical when examining data points from one organization. The strength of this correlation, particularly with three different vendors, indicates that this trend line would be appropriate for analytical use.
Note that Figure 1 demonstrates the correlation between size and productivity. Additional trend lines and correlations can be developed for numerous other metrics, such as effort, duration, defects and staffing levels. The development of trend lines is limited only by the data that is collected.
Using Historical Trend Lines
Once a set of custom trend lines has been developed, there are two primary ways in which they can be used: 1) analyzing and benchmarking completed projects, and 2) estimating future releases. Each of these will be discussed further in the sections below.
Assessing Past Performance
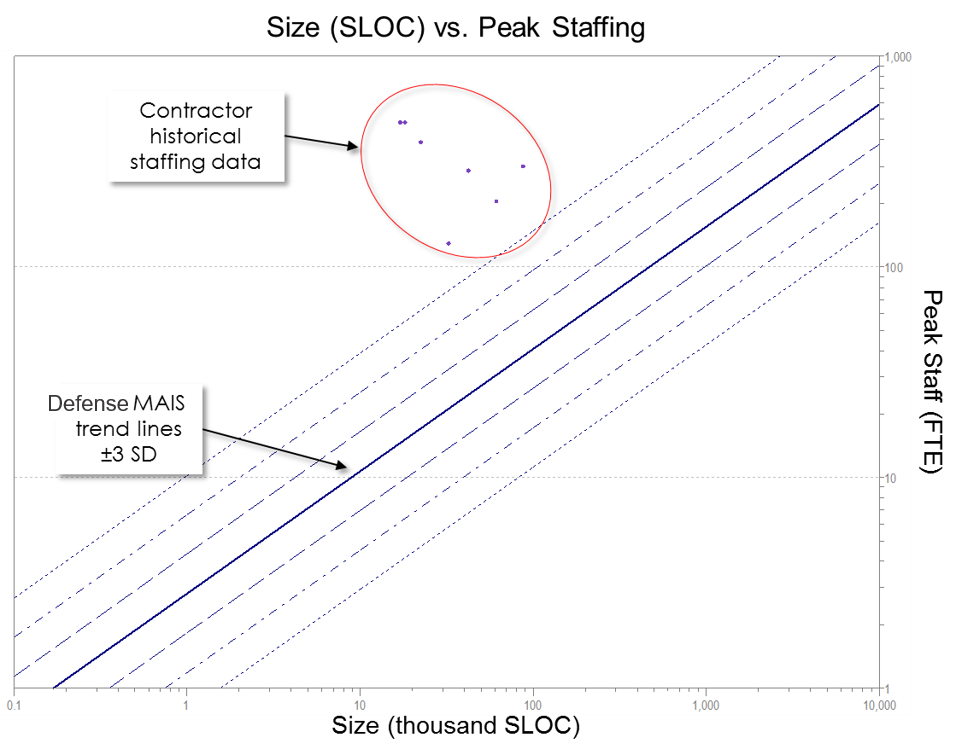
The use of historical trend lines can be instrumental in accurately assessing the performance of completed projects. Figure 2 shows the staffing trends for Defense MAIS programs, plus or minus three standard deviations from the mean. The data points plotted on this chart represent notional completed projects submitted by a notional contractor.

Figure 2. Contractor Data Reveals That Historically Completed Projects Use Staffing Levels Three Standard Deviations Higher Than Comparable Defense MAIS Programs.
When compared with other Defense MAIS systems, this contractor is using significantly more people to complete its releases. Upon initial examination, this chart raises some questions. Why did this contractor need so many people when other vendors were able to deliver the same functionality with a fraction of the staff? Might there be a reason for this behavior? Perhaps the contractor was behind schedule and hoped that adding more people would help the team complete the program on time. Was this a time and materials or a fixed price contract? Perhaps this contractor used large teams as a means of billing more work if the contract type was favorable to this strategy. These questions are justifiable and pertinent, since actual, historical data is demonstrating a large variation from what might be expected (such as shown in an independent estimate).
When conducting benchmark analyses, at least two areas should be examined. First, it is recommended that an assessment of the following core metrics be conducted: productivity, duration (time to market), effort expended, staffing, and reliability/defects (if data is available). Second, these metrics should be compared against industry trend lines and the distance between the two points should be quantified.
These types of analyses can shed light on the various factors that might have impacted project performance and can give clues as to what adjustments can be made to improve processes in future projects. This same technique can also be applied to the vendor selection process. If all potential vendors were required to submit data from comparable completed projects, the acquisition or source selection office would be able to plot these data points against industry trend lines to validate the submitted bids. This would serve to determine the likelihood that the vendors would be able to complete the work according to their proposals and historical performance. It would also help determine whether the bids were feasible against the government’s independent (or “should cost”) estimate and within its expected schedule and budget. Quite obviously, this serves a valuable purpose for acquisition, budget, and oversight offices alike.
Estimation
Aside from benchmarking, the other main use for historical trend lines is in estimating future releases. Before getting into specifics, it is important to first understand the best practices for project estimation. At the beginning of a project, when the least information is known, a top-down method is the quickest and easiest way to create an estimate. Several parametric vendors utilize this top-down approach to software estimation as well, though the assumed inputs and algorithms may differ somewhat among the various tools.
For example, QSM uses a proven production equation that is constantly adjusted and refreshed through the analysis of a very large set of actual historical data. The software production equation is composed of four terms, namely: size, schedule, effort, and productivity. Productivity is measured in index points, a calculated proprietary QSM unit which ranges from 0.1 to 40. It allows for meaningful comparisons to be made between projects and accounts for software development factors, including variables such as management influence, development methods, tools, experience levels, and application type complexity. This equation is described below:
Size = Productivity × Time4/3 × Effort1/3
The exponents attached to the time and effort variables differ significantly. The schedule variable, or time, is raised to the 4/3rd power while the effort variable is raised to the 1/3rd power. This indicates that there is a diminishing return of schedule compression as staff is added to a software project. In extreme conditions, this indicates that consuming large amounts of effort does little to compress the project schedule. This equation can be rearranged algebraically to solve for any of the above variables.
Using a top-down parametric estimation tool makes it possible to quickly create an estimate very early in the life cycle, when little information is available. If the size and productivity assumptions are known (e.g., from similar past performances), then it is possible to calculate the duration and the amount of necessary effort. Early sizing methods can be based upon analogous program efforts, requirements, or function points and can be refined over time as more information becomes available. The size-adjusted productivity values can be taken from appropriate trend lines based on historical performance. This very technique has been used to successfully estimate and model future releases of Defense MAIS programs.
Refining the Cycle
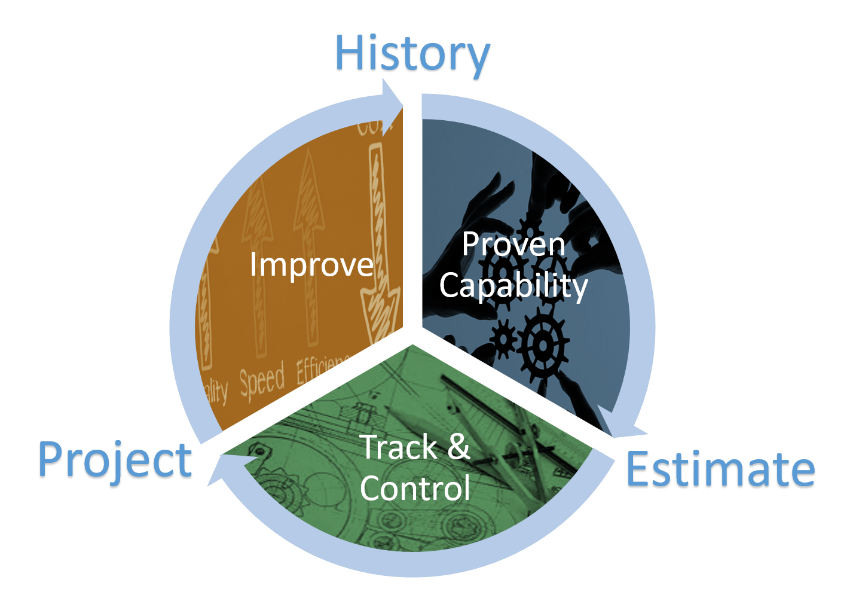
One of the major advantages of having access to historical data is that it can be used at any point during the software development life cycle. Figure 3 below describes this cycle:

Figure 3. Data Refinement Cycle.
When a project is in its early phases, historical data can be leveraged to create an estimate based on the developer’s demonstrated performance on other completed projects. Once accepted, this estimate can serve as the baseline plan for the program. Once the project is underway, actual data can be collected at regular periodic intervals (e.g., monthly) and tracked against the estimate to assess and characterize actual performance. If the actual performance deviates from the estimated plan, it is possible to reforecast the schedule duration and necessary effort (i.e., staffing) values. Upon completion, the final data can be collected and added to the historical data repository. An updated set of historical trend lines can be produced and can then be used for estimating future releases. Over time, you will begin to see that there is less discrepancy between the estimates and the actual outcomes (excluding the impact of external factors, such as changed or additional requirements, budget cuts, Congressionally mandated changes, or other factors unique to the Defense environment), thus refining the cycle to improve processes across the entire software development life cycle. However, more accurate estimation of factors that can be controlled certainly helps mitigate the overall impact of those factors that cannot. Estimation can also be done at an early stage, when the cost of adjustments is far less than later in the development process.
Summary
The British mathematician Charles Babbage stated that “errors using inadequate data are much less than those using no data at all.” This quote really speaks to the advantage that can be found in collecting an organization’s data or in the use of data available in the industry. As more programs complete, an organization can continue to add to its historical database, refine its estimates, and improve processes throughout the entire software development life cycle. With the assistance of an IT cost analyst, these process improvements — particularly as demonstrated within the DoD — can lead to significant savings in effort and schedule.
