This isn't croquet we're playing here. It's more like a horse race. There is money riding on it. A great big whip that bloodies the horse's flank and diverts its mind from the task at hand, running faster, is counter-productive. Similarly, great big whips like 80-hour weeks may tire the mind to the point where very difficult work is beyond the reach of those dulled minds. You have all seen, perhaps experienced, examples of this phenomenon.
The little whip we have in mind is metrics. Perhaps those of you reading this newsletter already subscribe to their great value. However, plenty of your brothers and sisters in the noble work of software development remain to be persuaded. In fact, the metric situation may be getting worse. Howard Rubin concluded (November 1998 ITMS), on the basis of data from 426 organizations reporting 1998 data, that "rigor in the world of software and systems is in a state of general decline, with the strongest decline in the US!" He based this conclusion on less use of lifecycle methods, metrics, process groups, and quality assurance by those reporting.
What is work?
Left to its own devices, in the absence of a little whip, we sleep late, eat a lot of junk food, and watch mindless television. What did you do last Sunday? On Monday, however, most of us have to drag ourselves out of this sloth and get some work done. Work is constrained by four factors:
•Time, because the product of our time has to get to market as soon as the product of other people's time;
•Effort, because our work time has a cost--our pay and our overhead--that has to be recovered;
•Productivity, because our work product has to be no more expensive than those of competitors;
•Quality, because poor quality work products don't compete successfully.
Since the human race left Eden (or the warmth of Africa, if you prefer), it has had to work to live. At first, very likely, the relationship between work and living another day was quite plain--we got hungry. Then we invented money and with money on hand, we could eat a while. Money--or profit--is still a potent driving force in small businesses. Then double-entry bookkeeping, in fourteenth century Venice, enabled proprietors to keep control of larger businesses. The "profit" motive still drives a fair percentage of the population and stock options permit a small percentage of the people in large organizations to feel that pull. People in small software startups with an ownership interest feel that incentive. For most of us, working in large organizations, "profit" is a remote possibility, even if we have a little stock. We need something more immediate, both to work by and to manage with.
That something is productivity
The difficulty is that we human beings have always had a lot of trouble reducing the concept of productivity to a number, a metric, that could spur us. Ancient farmers learned in the first few seasons of growing the new crops that hard work was only part of the answer. There was also the amount of rain, the quality of the soil, and the absence of searing heat.
Manufacturing productivity looked to be more straightforward.. You divided the number of pieces produced by the number of person-hours worked. Pieces per person-hour looked like a measure of productivity. Then you found that searching for the raw materials took unpredictable amounts of time or money, tools broke, machines got out of tolerance, and some pieces were defective. It got complicated.
One approach to measuring software productivity is analogous to manufacturing productivity, count the pieces produced. The "piece" selected for counting is usually the source line of code, or in many IT organizations, Function Points. That gives us what we will call "conventional productivity," SLOC/person-month, or Function Points/personmonth. Let's see what the QSM database can tell us about this measure. Figure 1 plots SLOC against person-months (both on log log scales). Each dot represents a project. If we imagine a centerline passing through the center of gravity of the mass of dots, we see that it slopes upward to the right. In other words, it takes more effort to build larger systems. Well, we sort of suspected
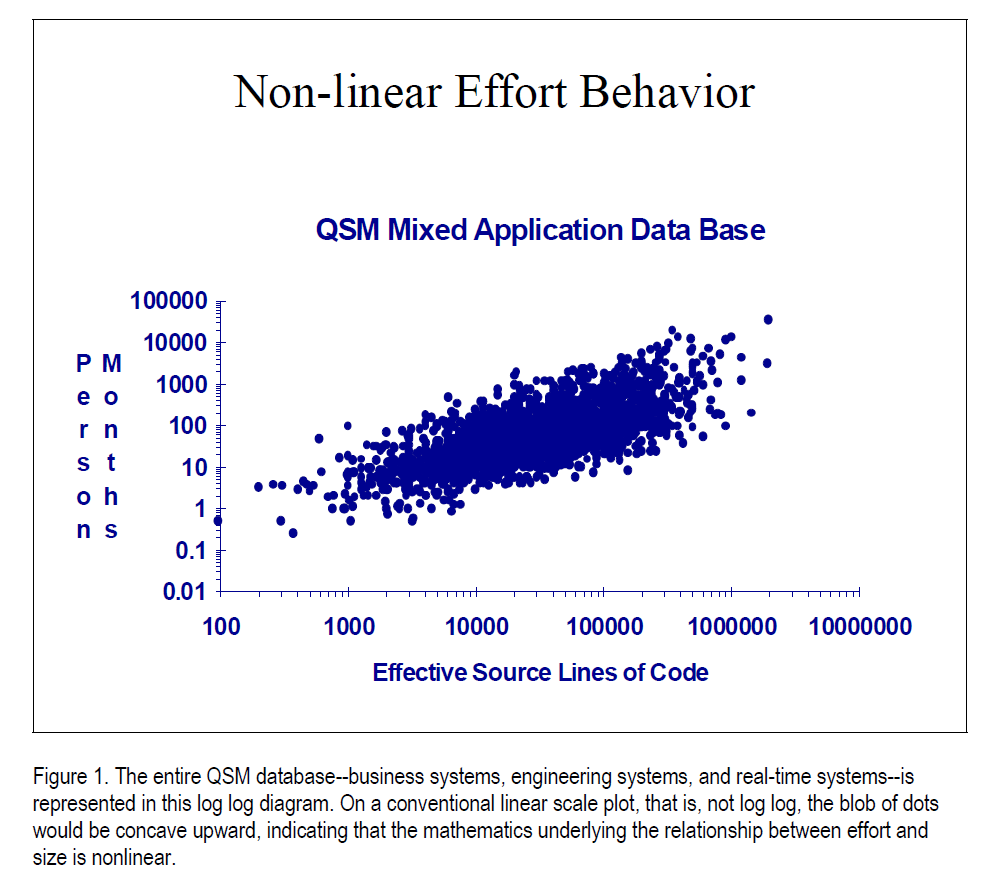
At any one system size, however, note the wide vertical dispersion of the dots. For example, at 100,000 SLOC, effort ranges from a low of 10 person-months to a high of 2500 pm. In view of this great (vertical) range, there must be other factors influencing conventional productivity besides project size. Of course, we all know as a matter of working knowledge that there are many such factors--developer skill, management knowhow, getting the requirements right, and a dozen or more others, depending on how we group and define them. In fact, these factors, whatever they may be, probably constitute that elusive property, software productivity, that we are trying to nail down.
Before we go into that, however, let us take one more look at conventional productivity. If a software organization always did projects of about 100,000 SLOC of about the same complexity, in pretty much the same application area, with pretty much the same crew of people, in pretty much the same way, then it would have pretty much the same conventional productivity from one project to the next. Its conventional productivity would fall on nearly the same point in the blob of Figure 1. It wouldn't be a bad figure with which to estimate the next job. That is probably why conventional productivity has lasted all these years.
Suppose the next project coming up is a different size. Suppose it is 10,000 SLOC rather than the 100,000 SLOC the organization is accustomed to doing. The estimator could slide down the blob (to the left) and pick a different operating point. A point about half way up the blob would yield the ratio, 10,000 SLOC/30 pm, yielding a conventional productivity of about 333 SLOC/pm.
Suppose the estimator knew from experience that the particular project organization seemed to be more productive than the average project organization. He could pick an operating point a little lower in the blob, say, by planning to use only 10 PM of effort. Then the conventional productivity would be 10,000 SLOC/10 pm, or about 1,000 SLOC/pm.
Obviously, trying to pick an operating point out of the blob, based largely on judgment, would not be a reliable guide to the next estimate. Still, it would be better than the blind use of a single conventional-productivity value.
As we have just seen, if an organization faces different size projects, in different application areas, with various teams employing different processes (or no process at all), its conventional productivity wanders around in the blob of Figure 1. The conventional productivity of the last project is not likely to be the conventional productivity of the next project to be estimated.
We need a better measure of productivity
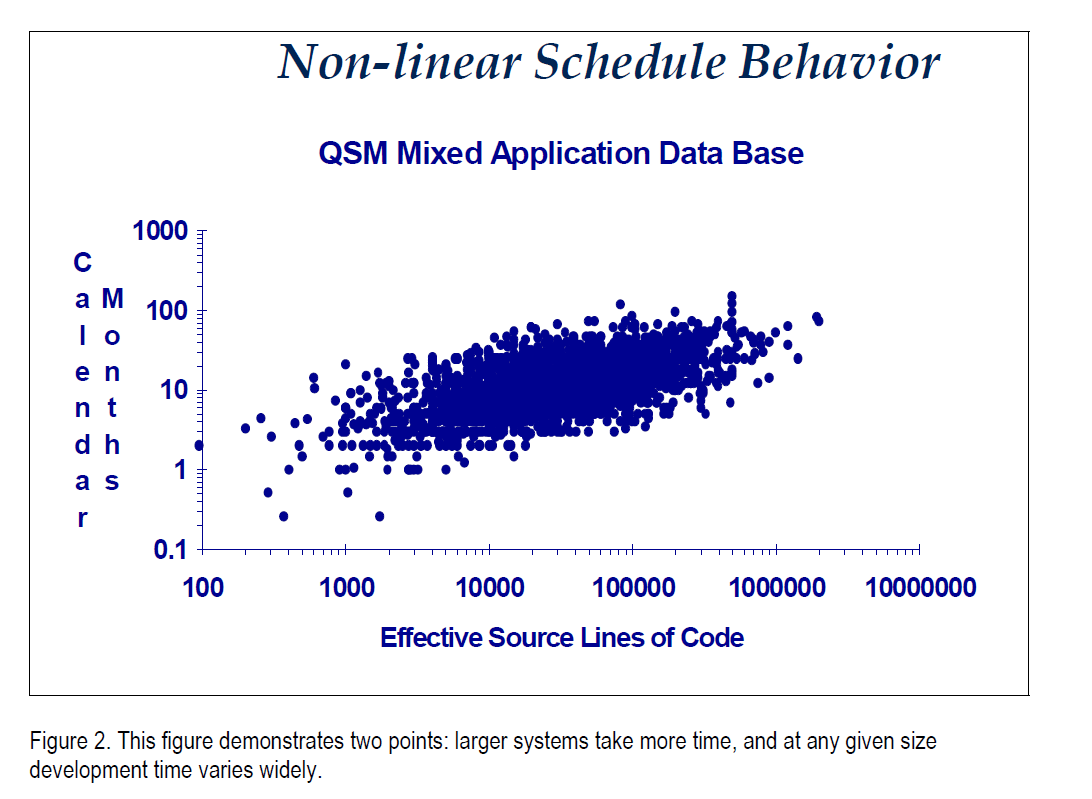
In Figure 1 we represented only two of the four variables with which we opened this column: size and effort. Let's bring in time. Figure 2 plots size against development time, again on log log scales. This blob tells us two things. Development time increases with system size. No big surprise. Development time at any given system size spreads across a large (vertical) dispersion. For instance, at about 10,000 SLOC, development time ranges from about two months to 80 months.
Let us put the four factors which we identified as constraining work in one relationship:
Work product (at a Quality level) = Effort over a Time interval at a Productivity level
Can this relationship be adapted to the metrics of software production? Work product (or quantity of function produced) is usually presented numerically in source lines of code. People also use function points, modules, subsystems, use cases, requirements "shall" statements, and other groupings. Essentially these are all representations of functionality in terms of size. Quality tends to be more amorphous, hard to reduce to a numerical measure. We have used defects per month and mean time to failure as partial stand-ins for quality.
We can represent Effort as the time in person-hours, person-days, or person-years put in by developers. Time is the calendar time in months or years the development takes. Productivity looks like it is going to be harder to attach a number to, as we have already discovered. Hang on for a minute. We'll get to it.
We also have two more facts to make use of. First, the relationship appears to be nonlinear, as the log log diagrams make clear. Second, time appears to be part of the software development relationship, as Fred Brooks observed a generation ago in The Mythical Man-Month. That should not surprise us, as time appears as one of the factors in the work relationship.
Therefore, it seems that we should have an equation representing software production of the following form:
Work product (at a Quality level) = Efforta x Timeb x Process Productivity
The work product (actually a representation of its functionality) is measured in some unit of size, generally source lines of code. Since the equation is to be nonlinear, we gave the effort and time terms exponents. Productivity is the great unknown, except that we know that conventional productivity will not be a good fit. So we changed its name to Process Productivity as a stand-in for some new entity. We are now down to three things we haven't nailed down: the two exponents, a and b, and process productivity.
The final equation did not spring into existence from inspiration. It was derived from data on size, effort, and development time on hundreds of projects. Here it is:
Size = (Effort/B)(1/3) x Time(4/3) x Process Productivity
B is a constant that has the effect of giving greater weight to the effort factor in very small systems. Still, effort, reduced to the cube root, has less influence than time, raised to a power greater than 1. This emphasis on time in the equation means that the time planned for development is extremely important in software development.
That leaves us with Process Productivity named, but still not reduced to a number. We accomplish that by calibration. With completed projects, there is a record of size, effort, and time. Therefore--
Process Productivity = Size divided by [(Effort/B)(1/3) x Time(4/3) ]
Calibration of projects recently completed by a software organization gives us a number representing its process productivity. We can use that number, not only to estimate time and effort for future projects, but also to measure process improvement from year to year. It is the "little whip" that doesn't bloody us, but keeps us working.