No point of view, once expressed, ever seems wholly to die.
Alexander Gray 1
We are indebted to Capers Jones for calling our attention to the fad-like nature of many technologies. “The half-life of many software technologies appears to be about three and a half years,” he writes. 2 However, he hastens to add:
“Some software technologies have lasting value and continue to be used indefinitely.”
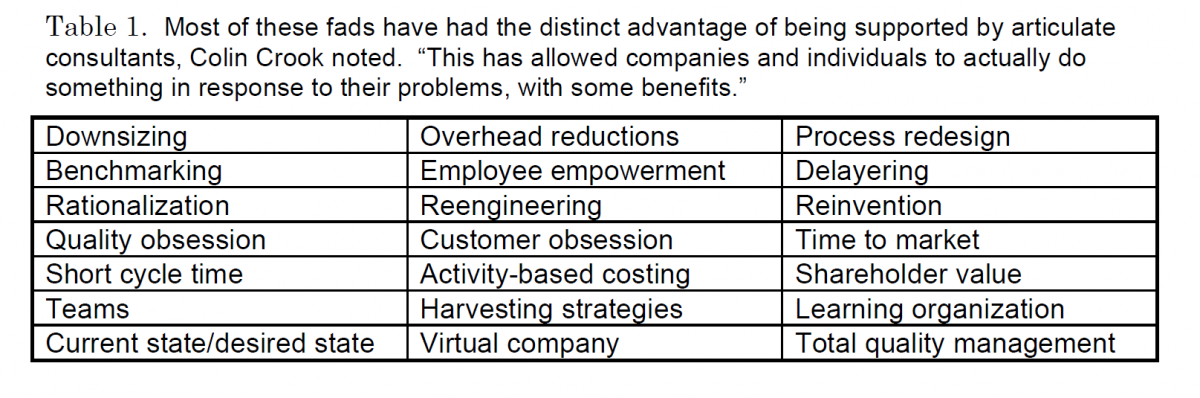
Next day the March issue of American Programmer brought us Colin Crook’s rumination on “the incredible number of business ‘fads’ we have tried out over the past 50 years.” 3 See Table 1.
Then we saw on article on the “bohica” factor—meaning “bow out, here it comes again.” Eileen Shapiro, a consultant, says the “bohica” factor refers to the widespread employee practice: “One simply pretends to go along with whatever the latest slogan or technique is, but puts in as little real effort as possible, in the belief that this too shall pass.” 4
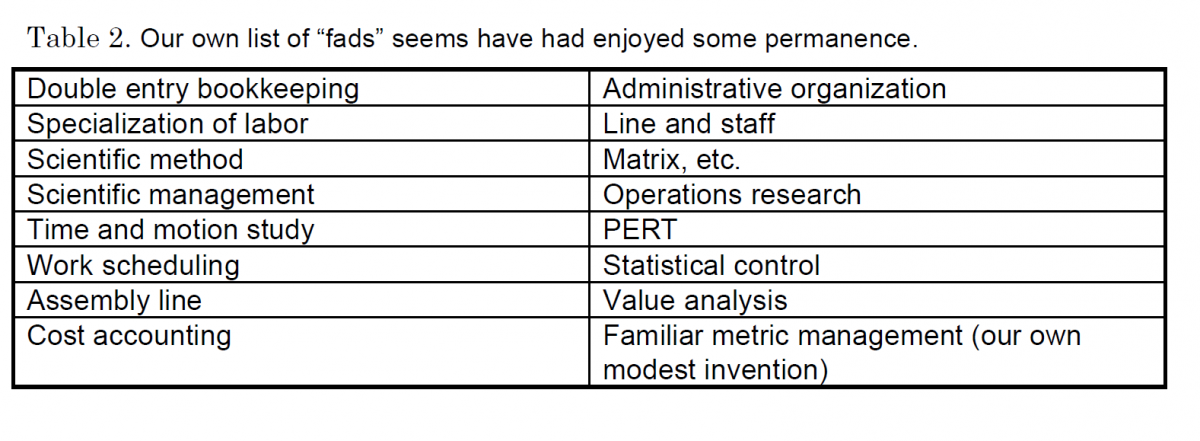
Meantime, Crook’s list of “fads” inspired us to drag out of our memories the list contained in Table 2, starting with double-entry bookkeeping in 14th-century Italy. Perhaps we are biased toward metrics, but it seems to us that metrics does indeed underlie nearly every item on our list.
Software process improvement
“The topic of software process improvement is now approaching three years of press coverage, although it is actually somewhat older,” Capers Jones continued. “In any case, process improvement is currently on an upswing and expanding rapidly throughout the software industry. However, unless solid quantified results based on process improvements are published, this interesting technology may also fade from view.”
We would not presume to question Capers’ evaluation of press coverage, for we read little beyond Dilbert in the press. It is our belief, however, that software process improvement is a sturdier technology than he lets on, viz:
- It has been going on since assembly language replaced machine language in the 1950s.
- Our metrics show improvement since 1975, considerably more than three and a half years back.
- We prognosticate that improvement will continue for more than three and a half years to come.
We have been following the progress of one company continuously since 1975, as shown in Figure 1. The company is the Data Systems division of a large telecommunications organization. It is primarily engaged in business systems. It has the best record of sustained progress of any organization in our database, about one process-productivity index point every one and one-half years. This rate figures out to be 16 percent per year, surely a very long-lasting “fad.”
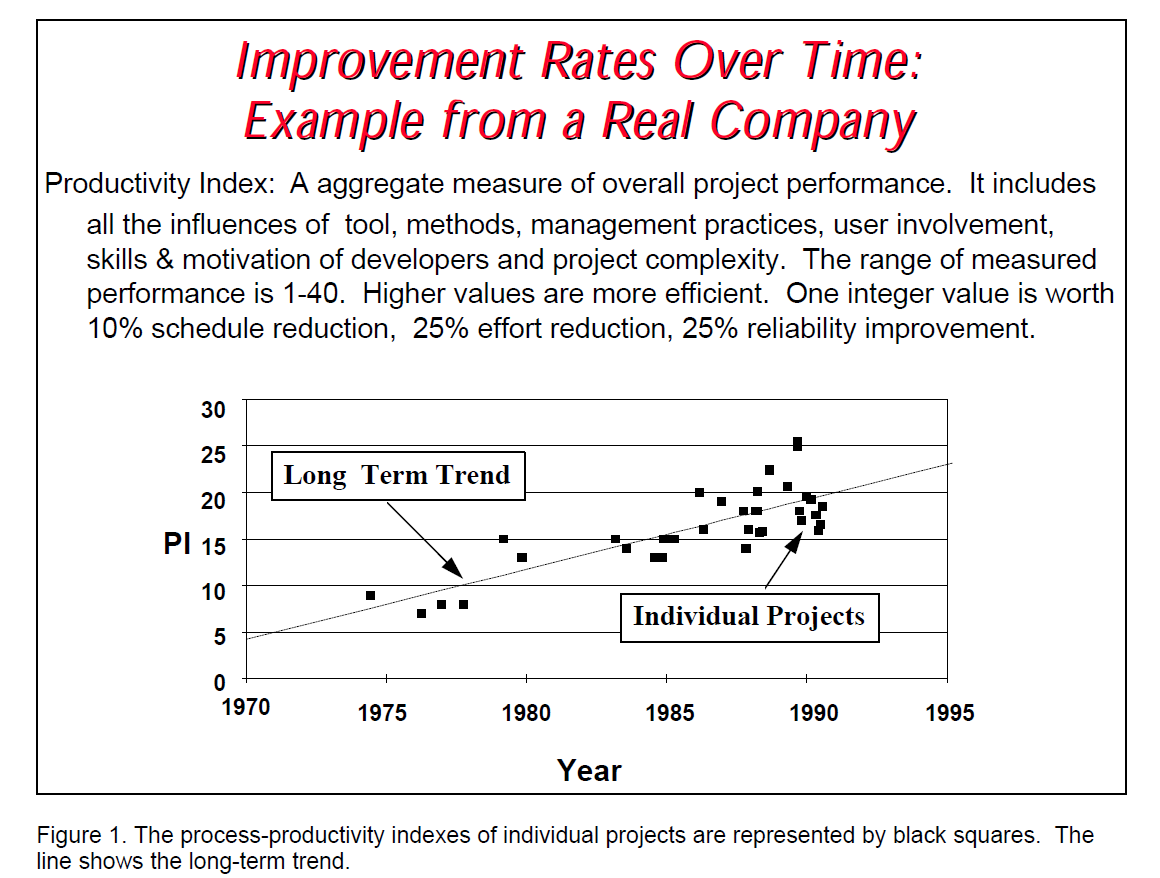
The average rate of progress of the business organizations in our database, of course, is much lower: one productivity index every 2.5 years, or 10 percent per year. That is still a very healthy figure. The figure for the economy as a whole in recent years has been on the order of one percent.
As shown on Figure 1, the average rate of progress over these 20 years has been remarkably steady. Even though no data points are shown for the last several years, informal contact with the company indicates they are still following the projection line nicely. There is little indication that this progress has been a three-and-a-half year fad. Individual projects, of course, vary from the average for all sorts of reasons—management experience, people skills, work difficulty, tool and methods availability, etc.
We divide software systems into three broad classes:
business, engineering systems, and real-time systems. The latter two classes are more difficult than business systems and the process productivity gains have been slower. Engineering-systems projects have gained about one index point every three years, equivalent to eight percent per year. Real-time systems projects trail with approximately one index point every four years, or six percent per year.
Companies reporting data to us are probably, in general, superior to companies that do not. Many nonreporting companies do not even keep project records. What our data does show is that companies that make a consistent effort over time do, in fact, improve their software process substantially. Everyone should get on board this “fad.”
The future is what we make it
If the companies reporting to our database continue to improve at the rate they have demonstrated, they will reach the process-productivity levels listed in Table 3 in the year 2000. This growth rate—of one or two index points—does not look very astonishing. Remember that the process-productivity index is a linear scale. Behind it stands the exponential process-productivity parameter scale. On that scale the growth in the next five years appears more substantial.
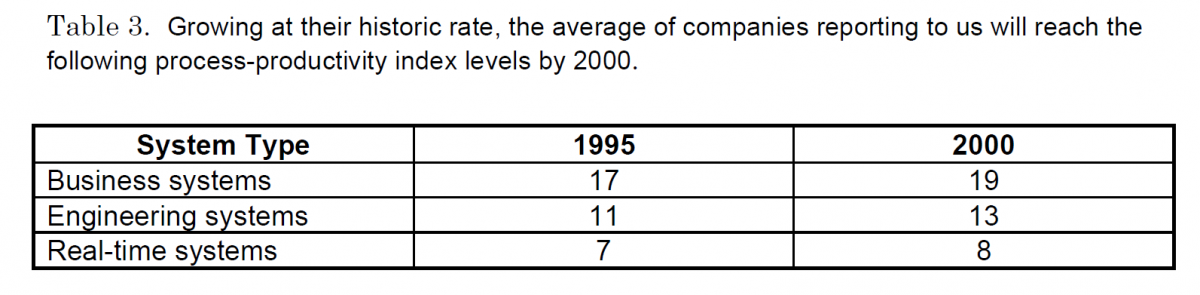
You might ask, is there room ahead? Can software organizations increase their efficiency? Yes, we answer, there is room ahead. The index numbers in Table 3 are the averages. Half the organizations are doing better already.
The room to improve lies in three directions. One is the automation of functions now done by hand, as such technologies as program generators and CASE tools attempt to do.
The second is the reuse of software components, reducing the quantity of new design and code that takes time and effort to develop. Let’s just mention a few of the buzz words in this area: objects, frames, frameworks, vendor-supplied components, domain analysis, repositories.
The third is management—effecting change, creating the learning organization, empowering people, developing the culture. These elements lead to accomplishing the first two: automation and reuse.
Let us cite just one study showing the scope of the room ahead, that of our associates, Ira Grossman and Michael C. Mah, in Pittsfield, Massachusetts. Nine large organizations submitted metrics on 15 business projects. The projects were typical in size, with a median of 74,563 lines of source code.
The average process-productivity index of the 15 projects was 26.2. The top two reached a PI of 30. On average the projects in this sample were 9.2 times as effective, in terms of the process-productivity metric (where the exponential nature is taken into account), as the average project in the business database. Yes, indeed, process productivity is more than a passing fad. All for now.
- 1. Alexander Gray, The Development of Economic Doctrine, Longman’s Green, 1931
- 2. Capers Jones, “The Pragmatics of Software Process Improvements,” Software Process Newsletter, No. 5, Winter 1996, pp. 1-4.
- 3. Colin Crook, “Strategic Planning in the Contemporary World: Nonlinearity, Complexity, and Incredible Technological Change,” American Programmer, March 1996, pp. 9-14.
- 4. Eileen C. Shapiro, “The ‘Glow and Tingle’ Audit,” Wall Street Journal, Feb. 26, 1996.