What is the minimum of control that will maintain the process? Peter F. Drucker 1
We have been besieged in recent years with a flood of three-letter mnemonics, such as TQM, Total Quality Management and even OMM (for Ken Orr’s spoof, the One Minute Methodology). All claim to be new and capable of accomplishing wonders. We thought briefly of introducing TMM, Total Metrics Management, as a magic symbol.
On second thought, we remembered that the managers we know are just a wee bit cautious about the new. One old codger that we rely on for sage ruminations told us, “The trouble with that Windows 95 is the 95. It implies there are going to be a 96 and a 97 and a . . .”
Software metrics has had plenty of splendid ideas over the past two decades. They work, too—in some places. Trouble is, they haven’t spread the metrics doctrine rapidly or widely. In the portion of Howard Rubin’s 1994 industry survey, reported last May, he found that only 20 percent of the reporting organizations had metrics groups. Some well-known industries had few or no metrics groups: distribution, government, and health care.
Maybe it is more than a coincidence that these fields all seem to be in trouble. Department stores, for instance, are being hard hit by Wal-Mart, which does have successful software. Government is being scrutinized by skeptical voters, many of whom have successful software on their ubiquitous PCs.
Could it be, we asked ourselves, that there are executives who are resisting the new and fashionable? Is there a place for the tried and true? Are there some constants under the incessant whirl of management acronyms?
Well, software development is, after all, a work process. The control of work processes by managers is not new. For instance, somebody controlled the building of the pyramids in ancient Egypt. Peter Drucker, now in his mid-80s, has been telling us about management control for 50 years, and many of the concepts he writes about predate him. Walter Shewhart and W. Edwards Deming were a generation before Drucker.
Thinking along these lines, we visualized an audience for the familiar. What better name could there be than “Familiar Metrics Management?”
The venerable nutshell
In a nutshell, in FMM there are only five basic metrics needed to control the doing of work: measures of (1) quantity, (2) time or schedule, (3) cost of resources, (4) quality, and (5) productivity. With these five metrics, you can carry on the six basic control functions of managers:
- Estimating, bidding, and planning the work;
- Setting completion or delivery dates;
- Supplying people and resources at the times needed;
- Monitoring progress of the work against the plan;
- Inspecting or testing the quality of the product;
- Monitoring improvement of the work process.
All organizations, even those without a formal metrics group, have these metrics, or some numbers that pretend to be them, or, at a minimum, some hand waving and shouting that pass for them. Sometimes the numbers exist, but are buried in unorganized files. Sometimes the definitions are not standardized and the collection methods are not disciplined. Nevertheless, to have any semblance of control at all, managers have to beguile themselves with the thought of numbers like these. Similarly, all organizations, even those at the bottom of various rating schemes, have to take a stab at carrying out the six basic functions—in the time they have between putting out fires. All we are trying to say is, the five metrics and the six functions are familiar.
Let’s apply these familiar metrics and functions to the field of software development, new-sprung as it may be by pyramid standards. What metrics do software people have?
- For quantity of product produced, they have source lines of code or in some cases, function points. The code metric may not meet the high standards of all researchers in the field, but even people who don’t keep metrics have some inkling of the number of source lines of code they are producing.
- For development time, they do make promises. That, in effect, is a rudimentary schedule. After the job is completed, late as it may be, they do have a record of the shipping date. It’s in the shipping department, if no where else.
- For cost of production, most organizations have a record of the personhours charged to the project. They can multiply that number by the labor rate to get cost in dollars. Of course, the numbers may be buried in accounting, where they are not doing working management much good. In principle, they could be dug out.
- Quality of product is a little tougher. We have to admit that many organizations do not have a number in this area. With a little effort, they could get one. Our first choice is: number of defects in requirements, design, or code found each month.
- Productivity is a little tougher, too. The commonly used metric, source lines of code per personmonth, is not very satisfactory. This rate varies with the size of the project and the time pressure under which it operates, as well as the factors commonly associated with productivity, such as equipment, tools, and people and management capabilities.
Pyramid control
Meantime, let’s start with something we can all wrap our thought processes around: the building of the pyramids. Fundamentally, a number of people piled big stones on each other for a period of time. The result was a big pile of stones. They could count them.
The priests running the projects found after a few months that 1000 men, say, could pile up 10 stones a month. That is 10 stones per thousand manmonths (there weren’t any “persons” in the work group in those days). One stone per hundred manmonths is the productivity rate of that kind of work. Sounds a lot like 10 lines of source code per programmer-month, the conventional software productivity metric, doesn’t it?
After a while the priests found there were some complications. Early in the project, putting the stones on the ground was fairly easy and the project ran a good productivity rate. A little later, putting the second layer of stones on top of the ground layer was a little harder, and the productivity rate fell. As the project proceeded to higher and higher levels, the productivity rate fell still more. Getting that last stone on top of the whole pile was very tricky. It took a long time and a lot of men. In this way the priests discovered that project time was a factor in the productivity metric.
Just so, and development time is an important factor in software productivity, too. That’s because the first layer of intellectual blocks has to be laid before you can move to the second layer, and so on. Of course, we don’t exactly put the time factor that way in the intellectual activity that is software development. Instead, we have the PERT idea that tells us that certain tasks have to be completed before other tasks can begin.
This work-pattern diagram tells us there is some critical path that sets the minimum time in which the project can be completed. The fact that some organizations do not create PERT diagrams (or the equivalent) for their work does not obviate the reality of this sequence of time relationships.
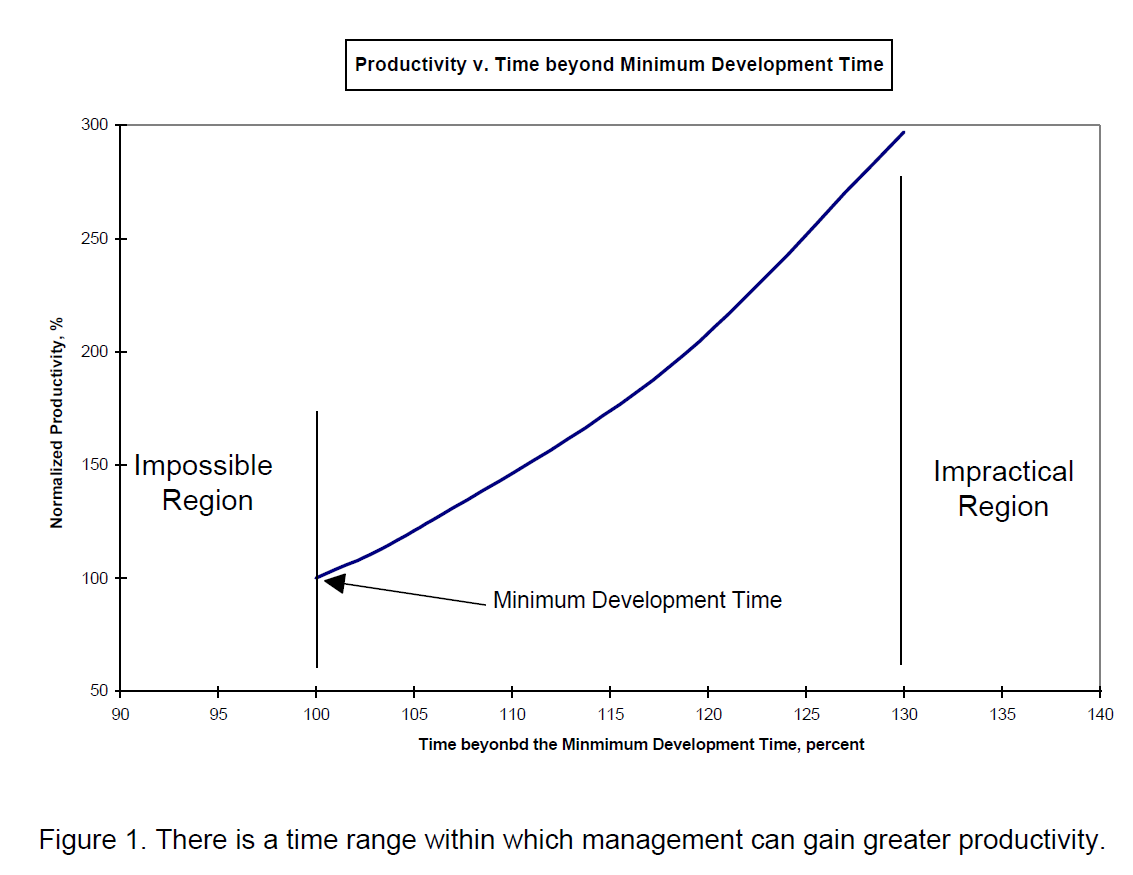
The degree of time pressure under which developers labor also affects their productivity. If the schedule is less than the critical time established by something like a PERT diagram, or a good body of historical data, they can’t complete the project at all. They have fallen into the Impossible Region of Figure 1. Net productivity, however measured, is zero, because there is no working output. At or just above the minimum development time productivity, measured in conventional terms, such as source lines of code per person month, begins to appear. It increases as management allows more time—within reason. Beyond about 130 percent of the minimum development time, the project enters the Impractical Region. It is impractical because customers can’t wait indefinitely for the product. Business has to move on. Possibly, with too much time, people begin to goof off, too.
How do we find a productivity number that takes all these factors—time pressure, size of project, and efficiency—into account? That will be our focus next month. All for now.
- 1. Peter F. Drucker, Management: Tasks, Responsibilities, Practices, Harper & Row, 1973, 839 pp.