 |
The QSM Project Database
The QSM database is the cornerstone of our business. We use validated metrics collected from over 7200 completed software projects to keep our products current with the latest tools and methods, to support our benchmarking business, to keep our customers informed as they move into new areas, and to develop better predictive algorithms. QSM began building its database in 1978. Since that time, we have collected project data continuously, updating the database every 12 to 18 months. We have added 200-400 validated projects each year during the last 5 years. Our primary source of data is our
clients, some of whom allow QSM to include their project data in
the database. QSM also collects data by permission through its ongoing
consulting work in the areas of productivity assessments, estimates,
and cost-to-completes. |
|
|
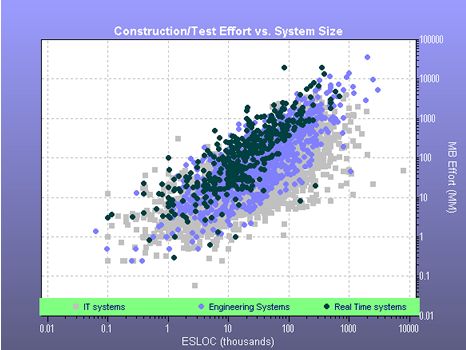
Stratifying the data by application type reduces the variability at each size range and allows for more accurate curve fitting. One application type, the Business IT projects, has been further stratified into several sub-groupings:
| Business
Government |
Business
Financial Client/Server |
QSM clients have several methods of access to the QSM database:
- Current industry trend lines for each of the nine application types are included with QSM tools. Only the most recent 2-3 years of industry data is used to calculate current trend lines.
- Basic queries on the QSM database are included with your license. Let us do the research to answer your estimating and benchmarking questions. We can provide graphs and summaries that allow you to compare your projects against both industry trend lines and actual projects that are similar in size, application type, and complexity. Note: more extensive query analysis is available through QSM's Basic Measurement Service.
- QSM's Basic Measurement Service can help you assess your current position against your competitors by cost, cycle time, and quality. Based on your present productivity and quality, we can help you set realistic goals for process improvement.
- Research papers and articles from our database analysis are available for download in the Resources section.
| |
|
|
| |
QSM
Software Research Bulletin |
|
| |
Books/Articles | |
| |
QSM Database | |
| |
About QSM | |
| |
QSM Clients | |
| |
What's New? |