When a project goes over schedule, costs too much money, or doesn’t deliver the desired functionality, business leaders may wonder what could have been done differently. Ask a professional estimator. Often, these are the people holding the crystal ball - those charged with planning and assessing the project before it even gets off the ground. We recently polled our own seasoned estimation experts at QSM to find out their thoughts. With many years of forecasting, tracking, and benchmarking software projects under their collective belts, everyone from our consultants to our support and sales teams chimed in to compile a list of what estimators consider to be the most critical software development management issues. These lessons learned (and methods to solve them) are invaluable to both project managers and C-level business leaders alike.
Failure to validate estimates against completed projects. Signing up to unrealistic expectations because of lack of historical data.
This is the elephant in the living room. We’ll focus on why this occurs later in this paper. Right now, let’s look at its impact. Organizations are creatures of habit, and this includes how they conduct software development. They exhibit patterns when developing software: how long it takes, how they staff, and how productive they are. When the estimates that form the basis of project plans conform to these patterns, they are in the realm of what is possible which may lead to successful outcomes. Many organizations do not retain and analyze their completed project data and are, in essence, flying blind, since they don’t know the scope of their capabilities. The most frequent result is that schedule and cost are understated and the project may either be over or understaffed. Many of these projects end up being cancelled after exceeding their budgets and schedules. Those that limp to completion often produce inferior quality software that exasperates end users, angers those who commissioned it, and leaves what remains of the development team exhausted, sullen, and updating their resumes.
The solution to this is simple: collect, retain, and analyze key data from every completed project and use it to define the performance boundaries for future work. The key data are:
- Project schedule. How long did it take to develop and what was the scope of the activities that were included? Some projects include everything from concept definition through a post-implementation warranty period. Others may only include the activities from low level design through completion of development and testing. This is important to know so that an apples to apples comparison can be done when estimating future development against past performance.
- Cost and effort. These are closely related; but if large non-development expenses are incurred, such as hardware or license fees, they should be listed separately. Effort should include the hours of developers, analysts, project management, and support staff that were required to deliver the software.
- Staffing. Both peak and average staff are useful. Agile projects tend to have a flat staffing profile, although it’s not unusual for additional scrum teams to be added.
- Defects. How many bugs were found and fixed during development? If a warranty period in within a project’s scope, how many were found then? Defects are normally broken down into between 3 and 5 severity categories.
- Size. This is a measure of how much software was developed and/or configured. Typical size measures for Agile projects are Epics, Stories, Story Points, and Features. Other size measures, that can be used for both Agile and Waterfall projects are Function Points, High and Low level Requirements, Logical Lines of Code, and RICEF objects.
The important thing is to capture these metrics and use them in planning for future projects, because they define what has historically been possible for an organization and help establish boundaries within which future work should be planned. When an organization does not yet have its own data for analysis and comparison, there are industry data that can help. While the best data is an organization’s own, industry data to compare against is way better than none at all. QSM’s SLIM-Estimate contains industry performance trends for staff, effort, schedule, and defects based on validated completed projects that can be used to show how a project estimate stacks up against the industry and whether it is too conservative or optimistic for staffing, level of effort, schedule, cost, and quality.
Failure to Re-plan
Helmuth von Moltke, chief of staff of the Prussian army famously said “No battle plan survives first contact with the enemy.” So, too, it is with software development. A myriad of factors can impact a software project. The list is extensive and constantly evolving. Moreover, it is not possible to know how these factors will interact with each other. Most can be summarized under two categories: 1. uncertainty about what is to be done and 2. uncertainty about the project’s productivity. When a project is first planned, staffing, schedule, and budget are established. The work to be performed is defined at a high level. As the project is decomposed into tasks and their dependencies (critical path), the scope of what must be done increases as the detailed plans reveal additional work to be done and complexities resolved that were not apparent from high level requirements. Also, new tasks may be added or others changed or removed. This is normal project behavior. It, too, needs to be accounted for. Regretfully, all too often plans are not revised to account for changes. When progress falls behind, there is frequently a tendency to say that the deficit will be made up in the next sprint or reporting period. Usually, this is wishful thinking. The best indicator of how a project will progress is its performance to date.
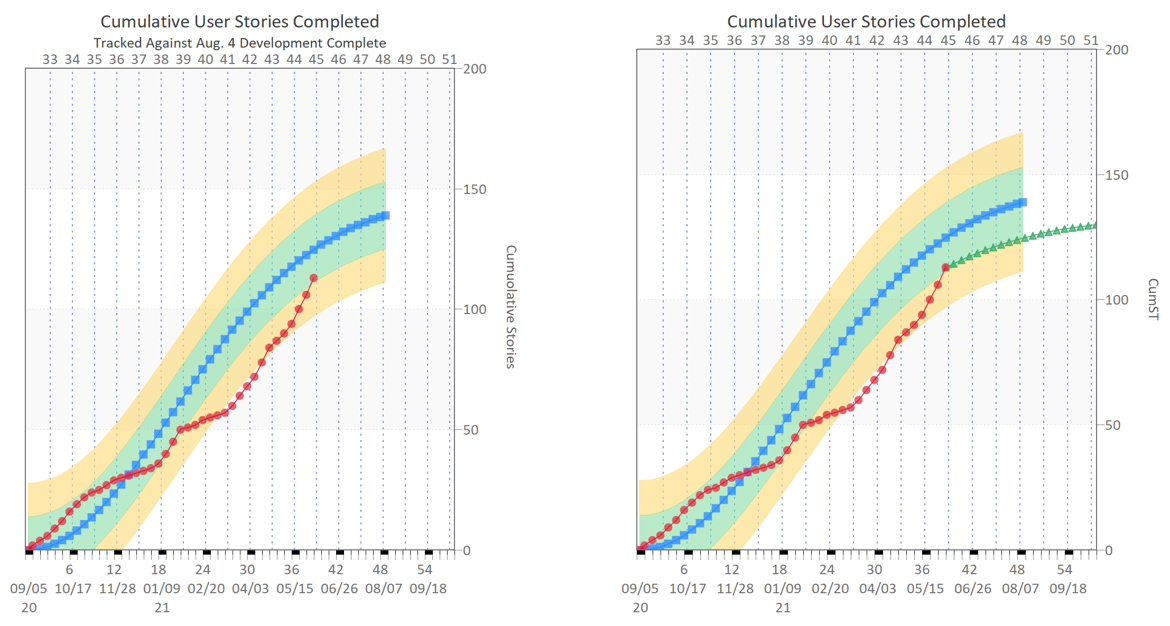
Figure 1: Planned & Projected Performance
The graphic above has two charts. The one on the left tracks completed user stories against their plan to complete development in sprint 48. The chart on the right forecasts where it will likely end based on performance to date (sprint 51). (The project actually completed in sprint 50 after some project scope was deferred to a future increment.) Past performance is not an absolute predictor of the future; but, it does indicate the probable outcome if left unchanged. More importantly, when deviation from plan is detected early, adjustments can be made, to help course-correct before it’s too late. The most common way to track project performance is by how well it conforms to its budget; not what it produces. By the time a project goes over budget, it is usually too late to take effective corrective action. This is because the largest component of budget is the cost of staff. If effort doesn’t deviate from plan, the project will appear to be performing according to plan until it overshoots its schedule. Simply stated, projects should be tracked against their plans using several metrics, a list that includes functionality completed, money spent, and when critical milestones actually occur. Then, as Moltke implies, the battle plan can be adjusted as needed.
Project/Program Management Issues
By the time a software project begins, many critical decisions that will directly affect its outcome have already been determined by leadership which will either help it succeed or handicap it. For example, too many failed projects were overly constrained by leadership who fixed cost, scope and schedule, without allowing any of these parameters to flex. Determining how software projects are prioritized and resources allocated to them in an organization can be a political process. Here are leadership pitfalls our estimators have encountered.
Lack of Statistical Thinking by Leaders
This ties directly to first issue identified in this paper: signing up to unrealistic expectations because of the lack of historical data. Software development has critical non-linear relationships which require a statistical perspective to comprehend. An obvious example is the relationship between schedule and effort. If 7 developers can complete a project in 9 months, surely 9 can complete it in 7 months. Right? Don’t they both require 63 person months of effort? Wrong! The number of communication points between a staff of 7 and one of 9 are very different and communication points are places where things can go awry. But, this is not intuitively obvious and leaders who do not have historical data or are not having it analyzed can easily assume schedule and effort are interchangeable, incorrectly commit to a schedule that cannot be achieved, thus dooming the project to failure before a single line of code is written. Leaders may not always like what a statistical frame of mind tells them, but the problems it avoids are well worth it.
Overconfidence in One’s Own Abilities
This is not just a problem for leadership. However, since they are the decision makers, poor choices can inflict disproportionate damage. In psychology this is called the Dunning-Kruger effect, a cognitive bias whereby people with limited knowledge or competence in a given intellectual or social domain greatly overestimate their own knowledge or competence in that domain relative to objective criteria or to the performance of their peers or of people in general. There is no simple solution to this; but, there are some indicators that help identify when it is occurring:
- Trusting one’s own intuition or gut level feeling when history and analysis indicate otherwise
- Dismissal of expert opinion
Most business leaders are in their positions because they have demonstrated competence and possess a keen political sense. An important part of being an effective leader is the willingness to seek out the guidance of those with better knowledge of the issues at hand.
Estimator Issues
The role of a software estimator is to provide input to leadership and project management that helps them to make informed decisions. The estimator is not the decider. This brings us to the first potential issue.
Communication
Regardless of how knowledgeable and competent an estimator may be, he or she must be an effective communicator. It is sometimes said, only half in jest, that individuals are considered to be good conversationalists who listen a lot and speak sparingly. Estimators have an additional burden. They may be experts in the minutia of estimation, but their challenge is to use that knowledge to address the concerns and needs of business and project leaders without overwhelming them. Leaders have very practical concerns:
- How long will a project take? (Will we meet a customer commitment, or market window?)
- How much will it cost? (Can we be competitive in the marketplace?)
- How should it be staffed?
- What will the level of quality be at delivery?
- What trade-offs can be done?
These are the questions the estimator should address, rather than presenting the theory of software estimation. QSM has found that graphics are an effective way to communicate with leaders and illustrate the trade-offs involved in software development. Leaders usually have an idea of how much they want to spend and how long a project will take. Often, these are understated. Rather than dismissing these plans out of hand, the estimator should replay them. Here is an example of how graphics can be used to aid business leaders in their decision making process.
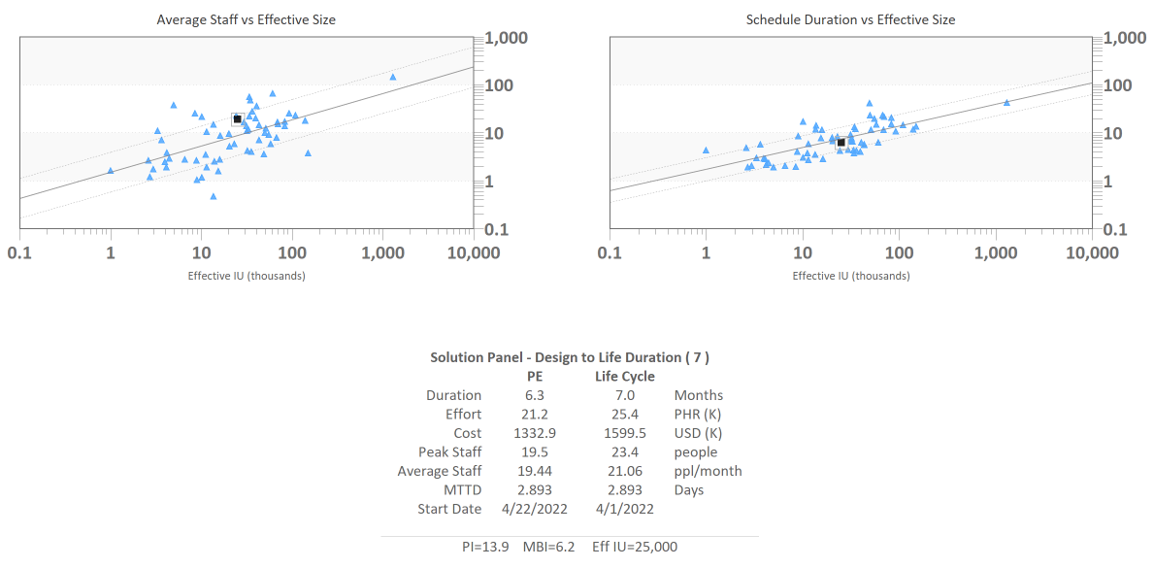
Figure 2: The 7 Month Solution
This is a hypothetical example of a development project estimated to complete 100 features, which are thought to be around 25,000 lines of code. Business leaders would like development to complete in 7 months, use a team no larger than 10, and cost less than $800,000. Productivity is assumed to be average, based on past performance. The estimator should briefly explain how the scatterplots work: that the dark line in the center is the industry average that is bounded on both sides by lines that represent plus and minus 1 standard deviation. This signifies that 2/3 of completed projects fall within that range. The blue dots are completed software projects that are used for comparison. The black squares represent the staff (l) and calendar months (r) that the 7 month solution implies. The Solution Panel summarizes these findings and indicates that to complete in 7 months, the project would cost a great deal more and require a much larger staff. Also, explain that the scatterplots indicate that this is not impossible; just more costly.
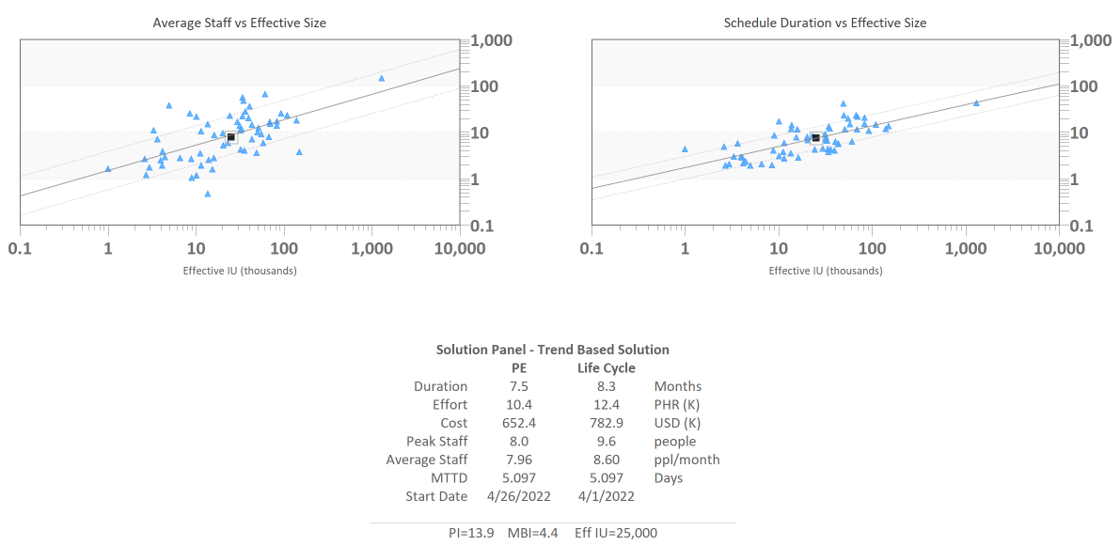
Figure 3: Industry Average Estimate Solution
Next, show the same graphic for a solution that is industry average for schedule, cost, and staff. It takes 8.3 months to complete, as opposed to 7; but stays within both the cost and staffing guidelines. By doing this, leadership is presented with a range of achievable alternatives that can help prioritize what is most important to them.
Failure to Factor in Risk/Contingency (Single Number Estimates)
When using a parametric estimation tool like SLIM-Estimate, the output as seen in the Solution Panels of figures 2 and 3 represents the most likely outcomes given the constraints. The actual results are equally likely to be greater or less than it. A 50% chance of not meeting the project plan is unacceptable, so it is important to present estimates as a range of probabilities and let the business leaders choose how much risk they are willing to accept. The higher the assurance level, the more it will cost and the longer it will take, so this is a balancing act.
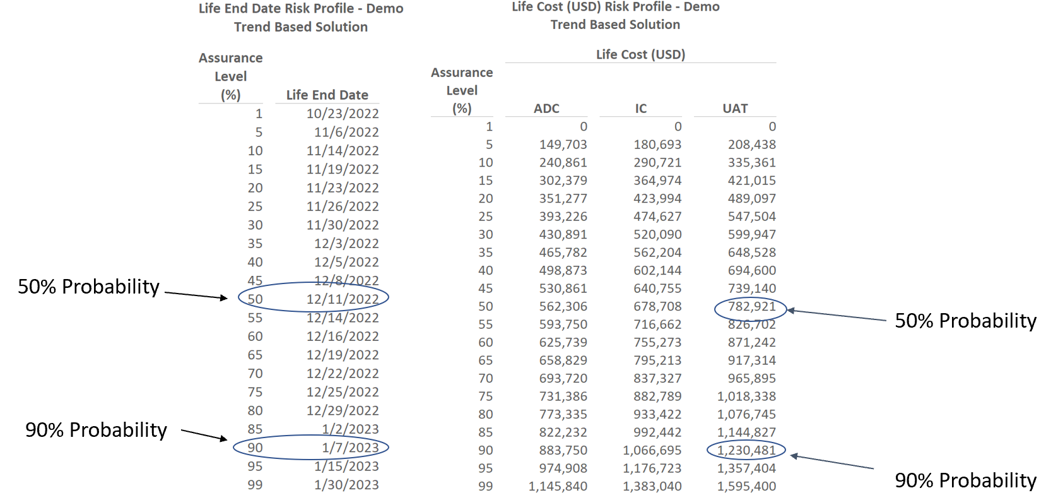
Figure 4: Schedule and Cost Risk Profiles
In this example, moving from 50% to a 90% schedule assurance level only requires adding 1 month to the schedule. However, 90% cost assurance requires an increase of 57%. The importance of presenting estimates as a range cannot be overemphasized. Estimates are based on incomplete knowledge and a projected development path. It falls squarely on the shoulders of the estimator to effectively communicate that an estimate is a range of possible outcomes and their associated probabilities.
Ignoring Quality until Delivery
How a project is staffed and the length of its development schedule directly impact not only how many defects will be found in development, but also how many latent defects will be in the delivered software. In a nutshell, large teams and aggressive development schedules, when compared to projects with more normal staffs and schedules, produce lower quality software. While lip-service is often paid to software quality in IT projects, it is more common to focus on completing the project within budget and on schedule. The result is that projects frequently attempt to test quality into the delivered software rather than build it in, which is not a successful strategy.
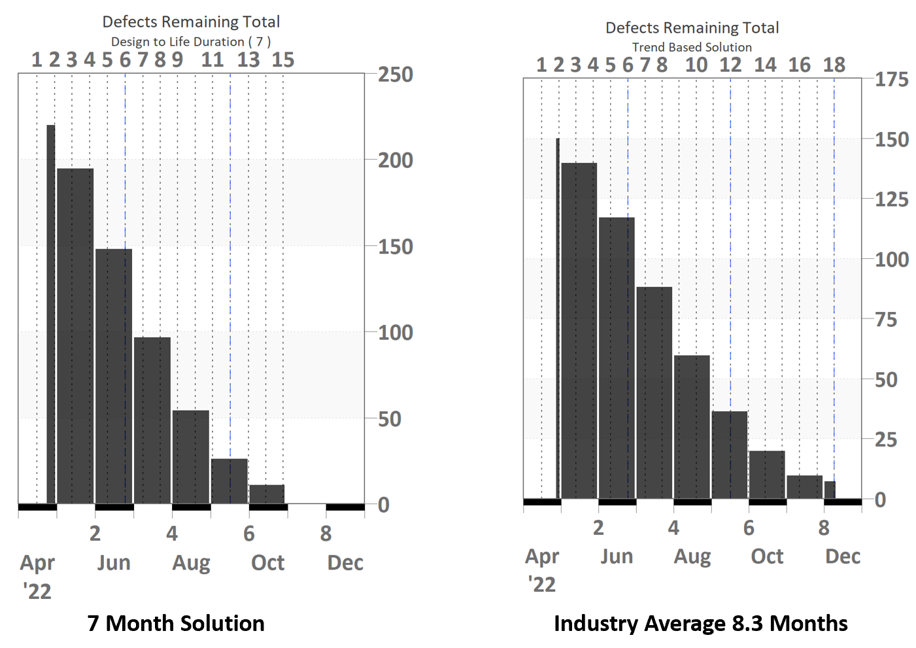
Figure 5: Quality Comparison
If we return to the estimate models in Figures 2 and 3, the 7-month solution and the industry average one, the impact of a large team and compressed schedule becomes apparent. Figure 5 illustrates this. The industry average model predicts a total of 150 defects with 7 slipping through to post-development. The 7-month solution predicts 220 defects with 11 remaining to be found in production. Since the impact of staffing and schedule choices on software quality may not be on the minds of project planners, this is something that estimators need to make sure to present to them. Bad quality software resulting from choices made before a project began can be avoided.
Poor Configuration Management and Change Control
The larger a project is and the longer it takes to develop, the more important these become. Small projects of short duration may succeed with informal processes. Larger ones do not. In designing these processes, keep these in mind:
- Communicate, communicate, communicate the what and how of this to the team and make sure you have their buy-in
- Automate whatever you can. The less burdensome and more invisible the processes are, the better
- Don’t punish team members for finding and reporting defects or suggesting changes
- When needed, provide training for those responsible for administering change control and configuration management
Estimator Turnover
One does not become a good software estimator because he or she has been given that role in an organization. Effective estimators combine specialized technical knowledge, good people skills, and diplomacy with the ability to make effective and convincing presentations. At QSM, we work with organizations that have been customers for many years. We have seen a great deal of turnover in estimators. While nothing is static, a great deal of time goes into developing a good estimator. Evidently, many of them see this as temporary assignment rather than as a career path. And then the process of developing a good estimator starts anew – along with all the pitfalls that entails both to the individual and the organization. As professional estimators, we at QSM may not be entirely impartial about this; but organizations should be able to reap the rewards of their investment. Early in my career, I had to justify the cost of the software I used and my position as “overhead”. My response was that if I kept one medium size project from falling into a ditch (which I had already done), I had paid for the cost of these for many years.
Conclusions
The issue of how to combine wisdom and knowledge with authority is not a new one and this is exactly the dynamic tension between those who must plan software projects to be cost effective, competitive, and a proper use of resources (business leaders) with those who create models based on history (estimators) that determine not only the realm of what is possible; but may also point to the best path forward. In “The Republic,” Plato wrestled with this conundrum 300 years before the common era (BCE). He concluded that this could only be resolved if philosophers became kings or king's philosophers. The pressures on both parties are such that this is difficult to achieve. But, to conclude on a positive note, here is another story from roughly the same era. In legend, after the Buddha achieved enlightenment the “Tempter” came to him. Paraphrasing, the Tempter said, “Yes, you have penetrated the meaning of existence and have achieved enlightenment; but to what avail? Only you have accomplished this; no others will be able to follow in your footsteps. The path is too difficult”. The Buddha dismissed the Tempter saying, “Some will”. So, we estimators will keep plugging along because some will listen and reap the rewards.