The Annual IT Budgeting Challenge
The time has come to begin the annual ritual: IT budgeting. It seems like you just finished last year’s budget and now it is time to start all over again. Not only is this task difficult, it is made worse by the fact that most organizations do it in an overly simplistic way. This often results in up to 40% of the projects grossly missing the mark, which wreaks havoc on the enterprise resource plans and results in disappointed business stakeholders.
Let’s take a look at the typical budgeting process as it exists today in most organizations. The call goes out to submit the project estimates for the portfolio of projects being considered, and the “sausage making” begins. It is often comprised of a multitude of disparate methods, which include expert opinions, detailed task-based spreadsheets, wild guesses, anticipated budget restrictions, and available resources, along with all the other methods. More often than not, it is simply a bucket of hours undifferentiated by roles and with no schedule attached. The individual estimates are aggregated and checked against the IT finance-directed budget limitation. If a reconciliation is required, it is usually in the form of a cut allocated to projects without regard to how it might affect functionality or schedule. In the end, we have a budget and, at the end of the year, we have upwards of 40% of the projects significantly outside acceptable limits, with all the accompanying headaches. At QSM, we believe this flawed method can be transformed into a business process that is infinitely more efficient and will deliver better value to the organization.
Our Process
Our IT budgeting process consists of five steps. The first step deals with the collection of project data that will enable the building of the budget. The second step is a basic feasibility assessment. Its sole purpose is to identify grossly unrealistic projects that are likely to fail and the ones that are ultra conservative and wasteful. The third step is to build the budget and show the resource allocation, cash flow, and total costs based on the “as submitted data.” In the fourth step, we adjust the “at risk” or conservative projects to more realistic scenarios and adjust the overall budget to conform to any organizational capacity constraints. During the fifth step, we consider all the alternatives that have potential to add value to the business or that are required to fit organizational budget constraints. Ultimately, a decision is made to adopt a particular course of action. Finally, the agreed upon budget planning data can be fed into a Project Portfolio Management (PPM) system to facilitate specific resource allocations and portfolio management.
Step 1 - Collection Process
In the first stage of the budget planning process, we seek to collect existing project estimates or create them from scratch. What we are really after is some basic information on each project. The necessary information includes:
- The estimated start and end dates of the project,
- The total effort and cost required to design, develop, and test the application, and
- A measure of the size (or functionality) of the system to be developed. We are flexible on the size measure, but usually it would be one of the following: Requirements, Epics, Stories, Use Cases, Function Points, Configurations and RICE Objects, or Source Lines of Code.
Depending on the maturity of an organization, this process can be either straightforward or may require a little more work. For example, if there is no standardization of estimation methods, then it typically requires more effort to sift through the spreadsheets and other artifacts to collect the information, make sure it is complete, and ensure that we have a basic understanding of how the estimation method produced its bottom-line figures. If a high level of standardization is in place, then it might be as simple as going to a central repository and generating a report. In most cases, the former scenario is the most likely situation.
Once the information has been collected, verified, and understood, it is consolidated into a digestible format. An example of this is shown in Figure 1.
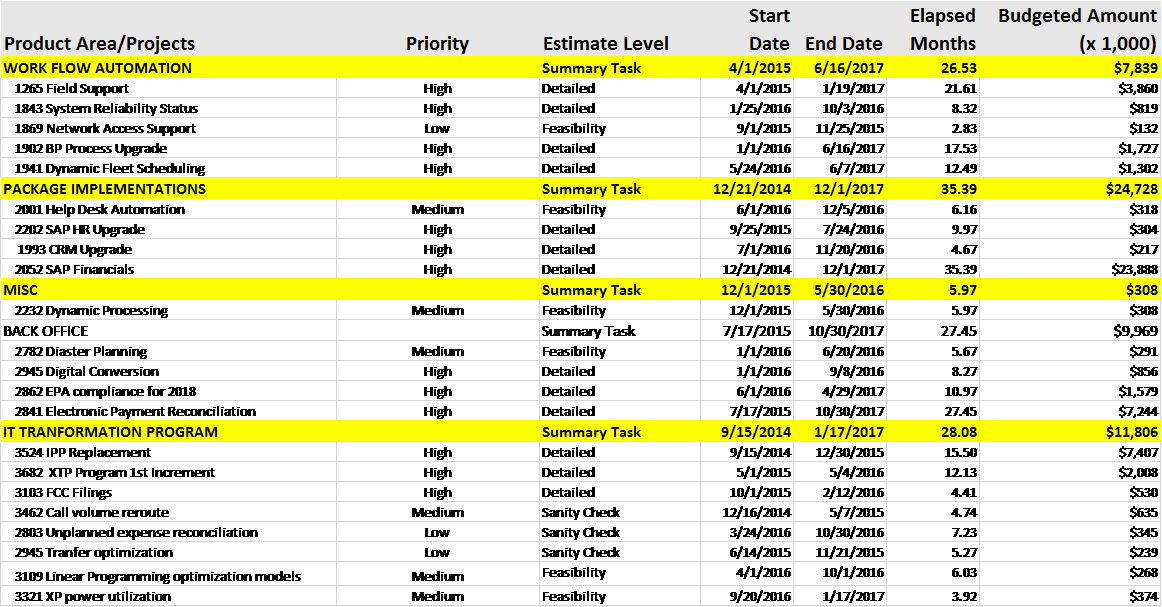
Figure 1. Consolidated Budget data: Summary table containing the budget submission data provided by each of the project managers responsible for the budget submission.
Step 2 - Project Feasibility Assessment
The greatest cause of IT project failures is unrealistic schedule expectations. In order to improve IT project performance in the eyes of the business stakeholders, this issue will need to be addressed. Our solution is to perform a basic feasibility assessment on each project as it enters the budgeting process. The goal is to identify wildly unrealistic or particularly conservative project estimates before expectations are set and “locked in concrete.” Ultimately, we will want to make adjustments to these projects, making them more reasonable and improving the overall project performance.
So how is this done? Start by creating a set of historical trend lines for schedule, effort, and staffing versus size of functionality produced. The trend lines provide a basis for the average capability that could be expected. It also gives us a measure of the typical variability that can be expected. Next, position the initial budget requests against the trend lines. The intention is to identify whether or not the projects are outside of the norm and typical variation; i.e., projects that are high risk or poor value. Figures 2 through 4 highlight some of the techniques used to identify those types of projects.
Figure 2 shows the risk level of the desired outcome of a project. When compared with historical data from the trend lines, the desired schedule of three months and budget of $250,000 would likely not be sufficient to develop 14 requirements. Moving forward with the current estimate would carry a high degree of risk.
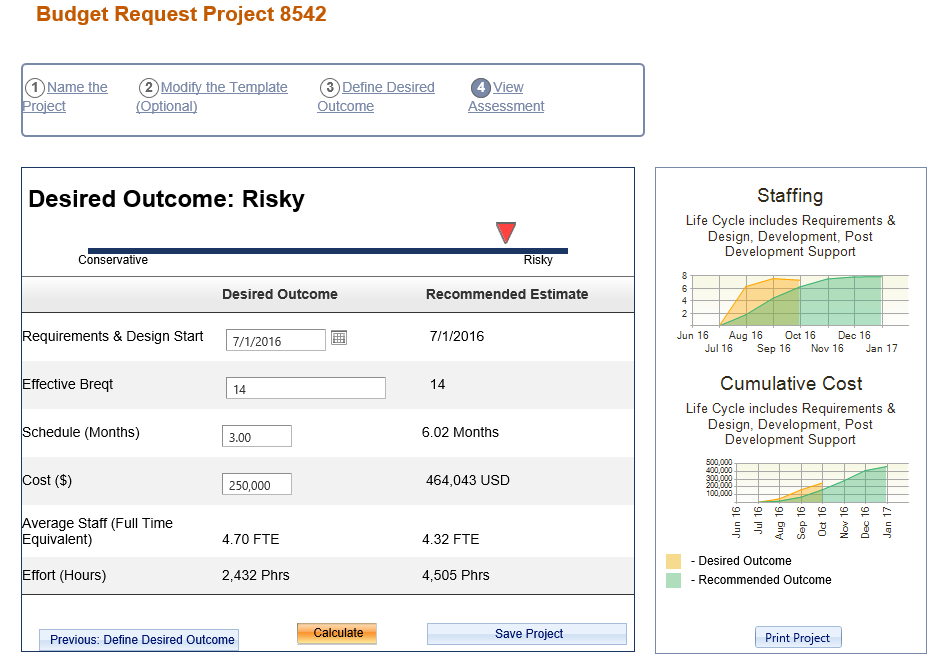
Figure 2. Feasibility assessment of the original budget submission. Notice that the submission or desired outcome is assessed as high risk and a recommended estimate is suggested which is more in line with historical data.
Figure 3 shows the estimate positioned against the historical trend lines for schedule, effort, and productivity. The estimate, depicted by a yellow diamond, falls more than a standard deviation from the average trend line in each area and indicates that, historically, this has happened less than 16% of the time. In this case, the productivity, which is the driving factor, is assumed to be too high, resulting in a risky schedule and too little effort.
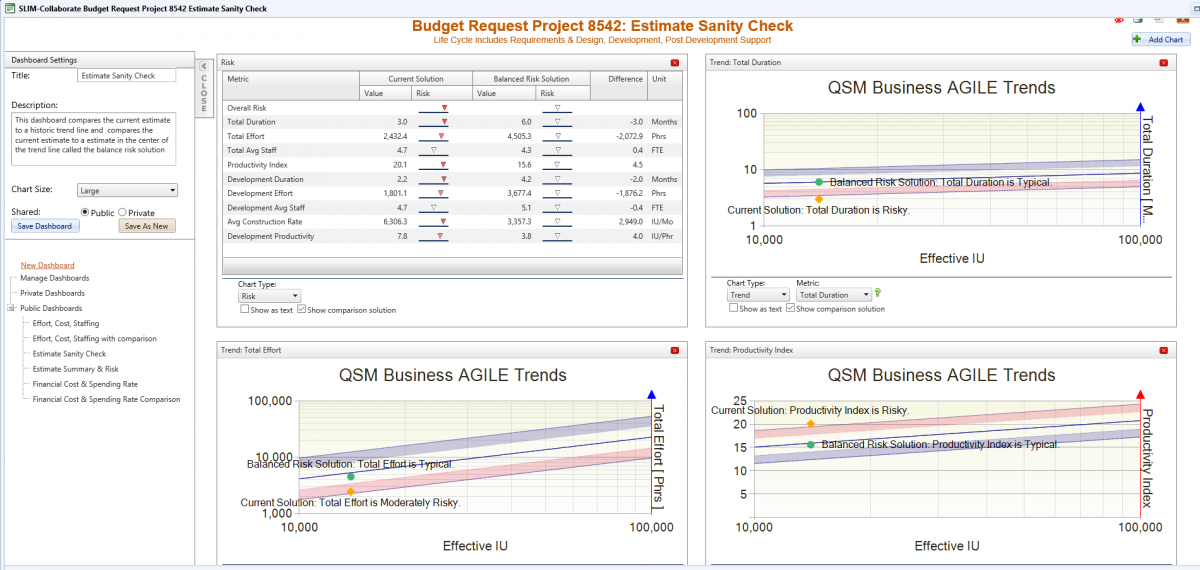
Figure 3. The budget submission (current solution, shown as a yellow diamond) is positioned against the historic trend lines.
Figure 4 shows all the projects relative to schedule and budget (effort). Ideally, the perfect position would be for all projects to be within the green target zone at the center of each graph. In this case, there are several projects with high productivity assumptions and are likely to take additional time and cost more. Those projects are risky (top left quadrant). The projects that are in the bottom right quadrant are opportunities to save money. The productivity assumptions are very conservative for the projects in this quadrant.
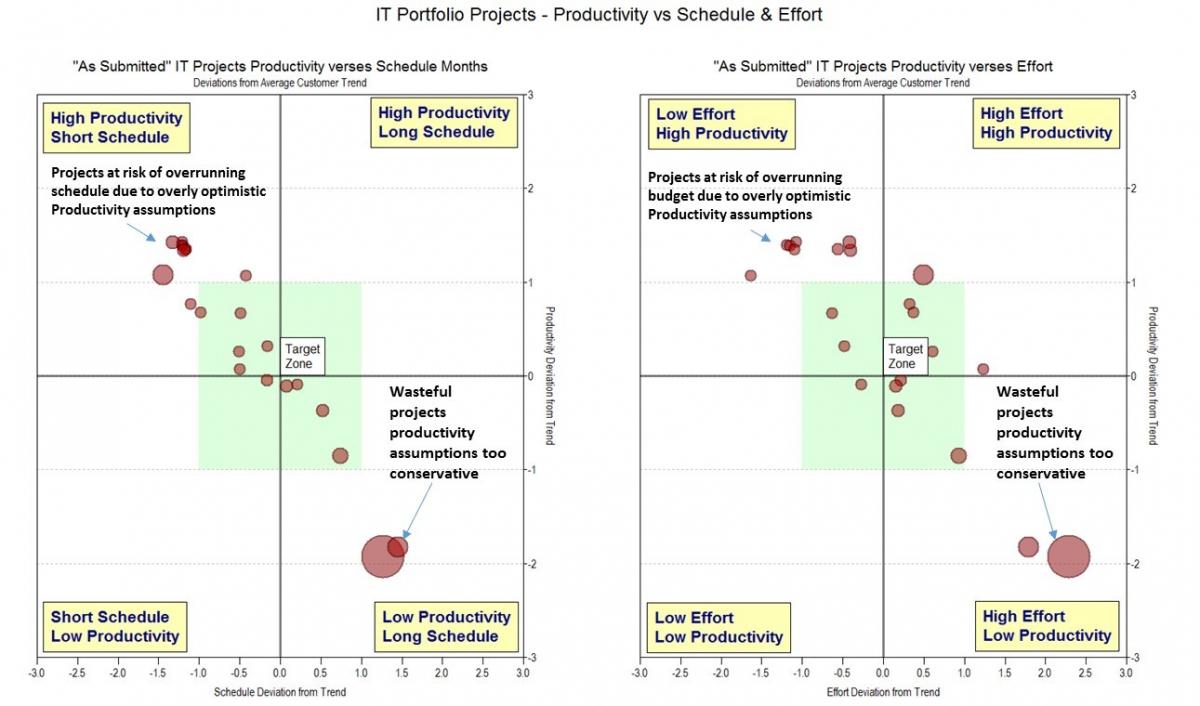
Figure 4. Quadrant chart showing every project’s position relative to having enough schedule and budget.
Step 3 - Building the “As Planned” Budget
The SLIM® Suite of Tools allows us to generate a staff, skill, and cash flow plan for each of the projects included in the budget submission process. It is possible to view how many people and their respective effort hours would be needed to fill each role/skill category at different points in time. This information is useful as it allows us to transform the data into peak demand points for various labor categories so that demand can be synchronized with organization capacity.
Additionally, we may need to use several different templates to accommodate differences in methodology or project types. For example, there might be a group doing Agile development, another that is implementing package solutions, and a third group building out infrastructure to support implementation. In this case, we would need three templates with the appropriate skill categories and labor rates for each respective development environment. Figure 5 shows how to identify each skill category. Notice that Project Management, Architects, and Business Analysis are the most expensive categories, while the Developers are sourced off-shore and have the lowest rates. Figure 6 shows how resources would ideally roll on and off one project over time.
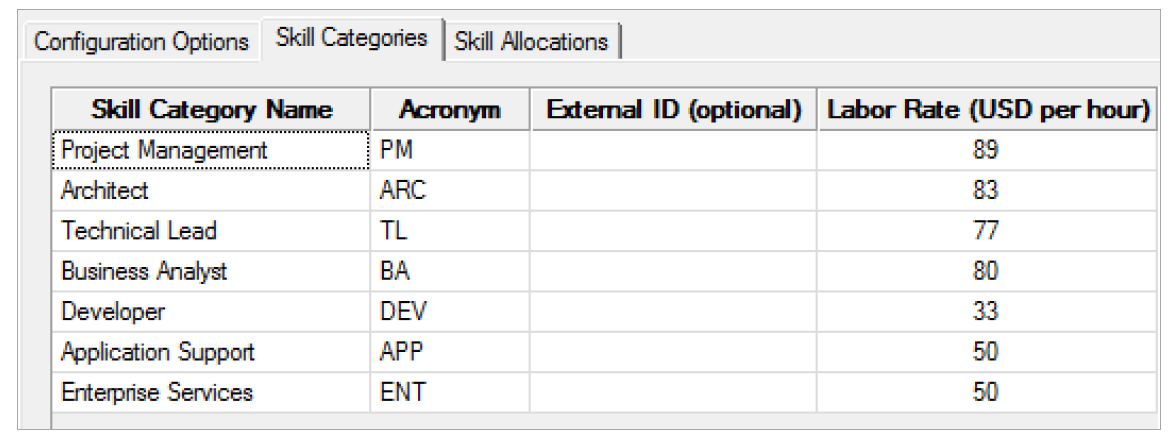
Figure 5. Skill category and labor rate configuration for an example template on our portfolio.
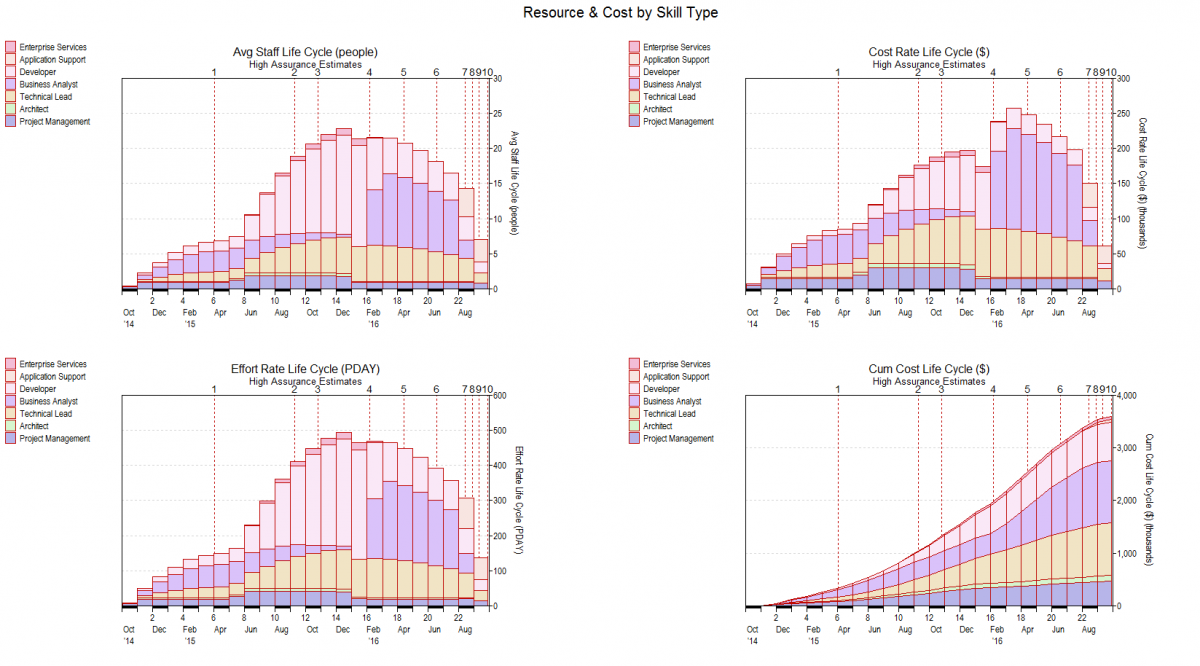
Figure 6. Resource estimate by skill type for a single project. The graphic shows staffing and effort by month as well as skill category, and displays the monthly cash flow and cumulative cost.
When all of the projects are consolidated and rolled up across the organization, we end up with an “as submitted” resource demand profile for the entire IT portfolio. Right away we can see the demand for various projects and resource types, the monthly spending profile by skill, and the cumulative cost – all useful business information.
Let’s make this a little clearer and work through the process with an example portfolio. In our case, we have a medium-sized portfolio that consists of four main product areas. They are work flow automation, package implementations, back office capabilities, and an IT transformation program. There is also an area for miscellaneous projects. Our example portfolio has 22 funded software development projects. In this instance, approximately half of the project managers submitted their own estimates. The other half were estimated with SLIM® using a trend-based solution, which produces “typical” schedules and costs based on the company’s historical data.
The following figure shows the start and end dates of each of the 22 projects in the Gantt chart on the left side. You will notice that we have projects that started as early as mid-2014, which are well under way. There are others that will not even start until mid- to late-2016. In any portfolio this would be quite normal. The graph on the right of the figure is a stacked bar chart showing the overall staffing requirement of each of the submitted projects. This proposed IT portfolio reaches its peak staffing demand in mid-2016, at approximately 225 FTE staff, and consumes approximately $55 million dollars. You will also notice that a significant portion of the resources are consumed by 3-4 large projects.
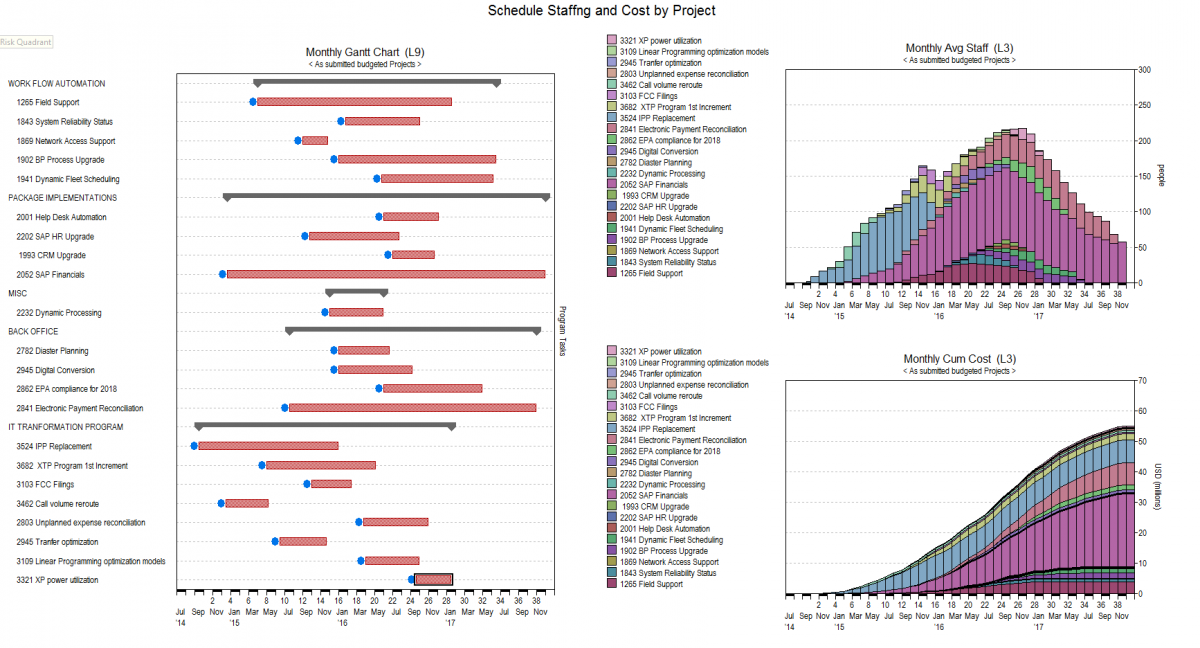
Figure 7. "As Submitted” IT Portfolio Schedules and Staffing by Project – notice that the peak staffing occurances in mid-2016 are approximately 225 FTE and that 3-4 large projects consume the majority of the resources.
Another view of the portfolio by skill categories and labor costs show some other important information. The peak spend rate will be $2.2 million dollars per month and occurs in mid-2016, when the peak staffing occurs (see Figure 8, top right graph). The Business Analysts are the most expensive labor category, coming in at $19 million, followed by Technical Leads at $16 million, and Developers at $11 million.
Finally, you will notice that there is a big demand for Business Analysts for a nine-month period of time between the end of 2016 and autumn of 2017. Based on the staffing profile, no new projects would be able to be taken on until December of 2016, at which point the staffing profile starts to decrease and resources would become available to begin new work.
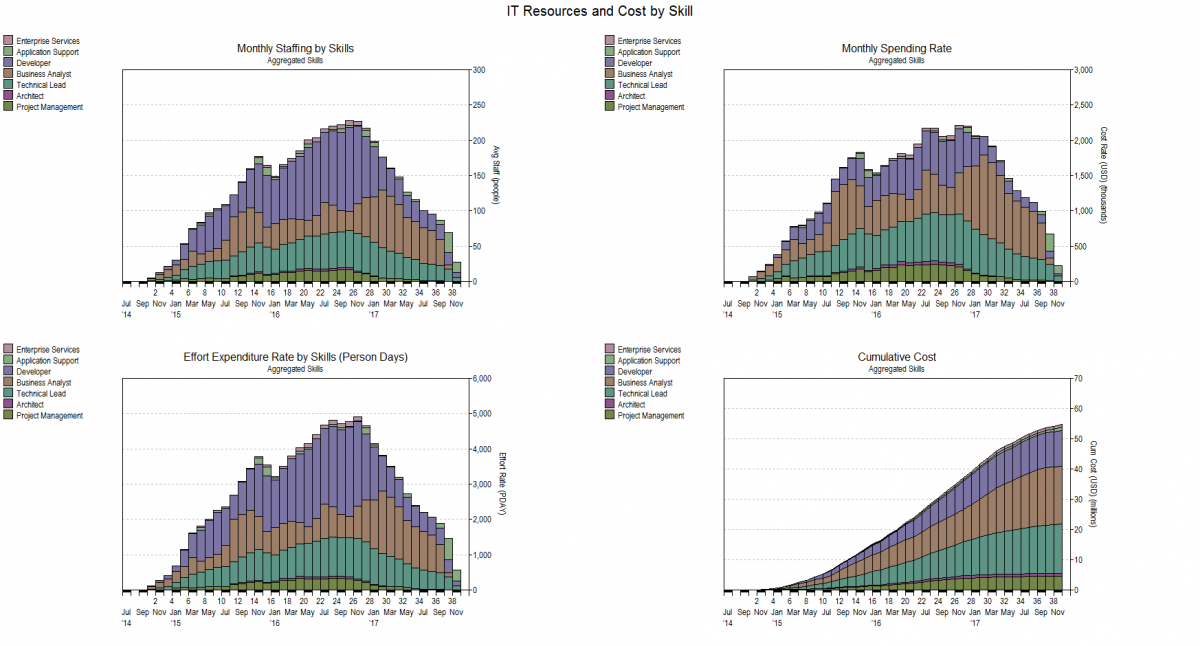
Figure 8. The example portfolio showing the IT resources and costs required by skill category. Each chart shows the aggregate view of a metric over time. The metrics displayed clockwise from the top right: Monthly Staffing, Cumulative Spending Rate, Monthly Effort, and Cumulative Cost.
Step 4 - Building the Optimized Budget
In almost all cases, there are certain constraints affecting the entire portfolio. In this case, the IT finance operation has requested that this portfolio not exceed a peak spending rate of $2.2M per month and the staffing capacity of the organization cannot exceed 225 people. Our submitted budget meets these criteria, but it also has a large measure of risk because many of the projects have very optimistic productivity assumptions while others are wasteful due to overly conservative estimates (i.e., low productivity and long schedules).
The first step in the optimization process is to adjust the “as submitted” portfolio to better reflect reality. Initially, the following adjustments are required:
- Projects that assumed a high productivity and resulted in a short schedule using low effort need to be adjusted so that they are more realistic. As budgeted, these programs carry a risk of significant cost and schedule overrun.
- The projects that assumed a low productivity and resulted in longer schedules and required a large amount of effort need to be adjusted because they are too conservative, and therefore, wasteful. These are opportunities to save money.
After the productivity adjustments are made, we now have a plan that is more realistic in terms of productivity but it now does not meet the staffing constraint or the monthly spending rate criteria. Figure 9 shows the revised portfolio. The peak staffing is just over 250 people and the peak spending rate exceeds $2.5 million, so some adjustments are required to satisfy the IT finance constraints. However, through the initial stages of optimization we have been able to identify $10 million in savings, mostly driven by the ultra-conservative estimates of two outsourced projects.

Figure 9. Productivity optimized portfolio showing that all of our projects are now located in the target zone. This reduces the risk of cost overruns and uncovers opportunities to save money on projects that are too conservative.
There are two methods to achieve alignment for the staffing and cash flow constraints:
- Delay the start dates for projects that have not yet started, or
- Reduce the overall staffing on projects that have not yet reached their peak loading.
In this case, we need to reduce the peak staffing by approximately 25 FTE staff, and there are seven candidate projects still to start where adjustments can be made. We delayed the start dates for each of these projects by two months. That alone was not enough to meet the constraints, so we made some modest downward staffing adjustments to five other projects with the largest staffs. The combination of these adjustments enabled us to meet the staffing and cash flow requirements and saved an additional $5 million by using smaller teams and stretching the schedule modestly. With the new budget in place, we can now see that the earliest that any new projects could be considered is May of 2016, when the staffing curve starts to “tail off” and can also see the resource by skill level for this optimized solution (see Figures 10 and 11).
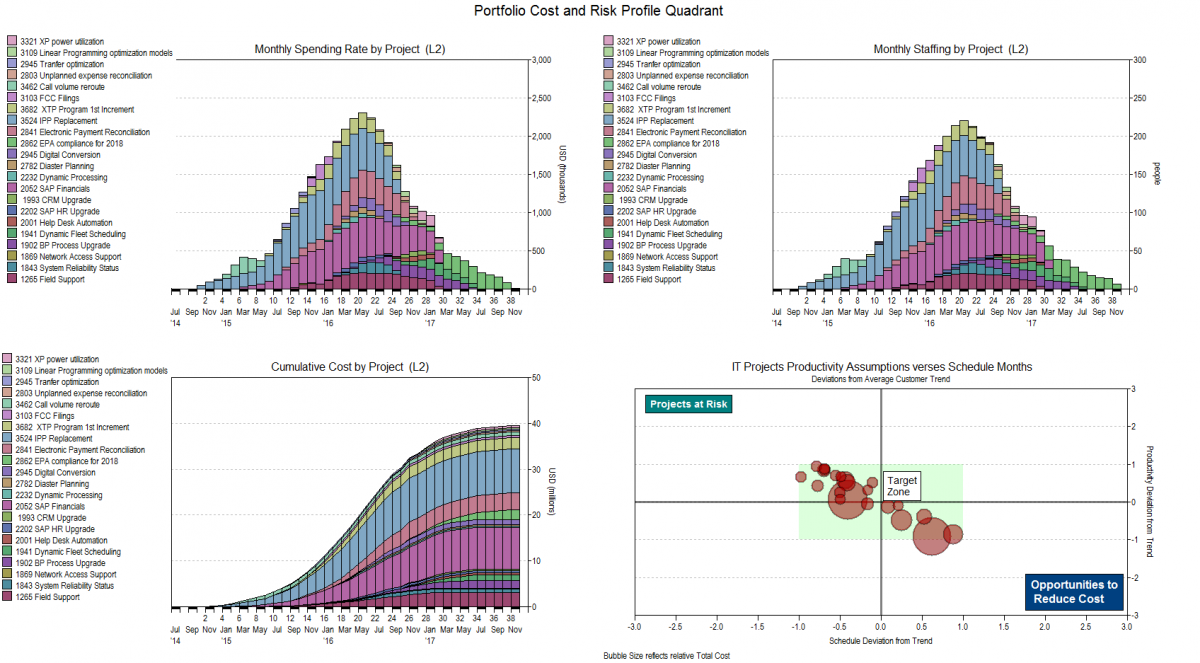
Figure 10. Optimized portfolio showing required project level staffing and optimized cash flow to meet the IT finance department budget constraints.
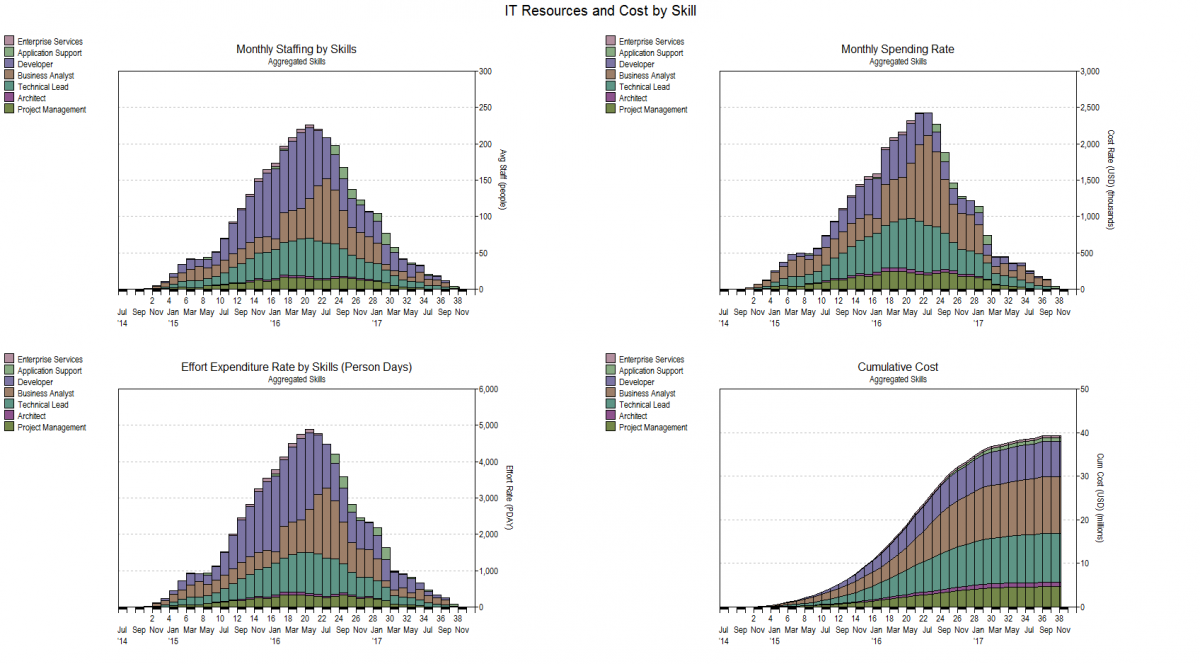
Figure 11. Resource by skill level for the IT budget that meets the budget constraints and has reasonable productivity assumptions.
A solution repository enables the collection and comparison of all noteworthy scenarios. It also provides configuration management for the entire process. Any potential solution can be added to the solution repository and reloaded for presentation or additional analysis. In this case, we use it to display the original budget submissions as well as our incremental steps to optimize for risk and waste and, finally, to optimize for cash flow and staffing constraints (see Figure 12). This process identified approximately $15 million in savings if acted upon, with little impact to the overall schedule of the portfolio.
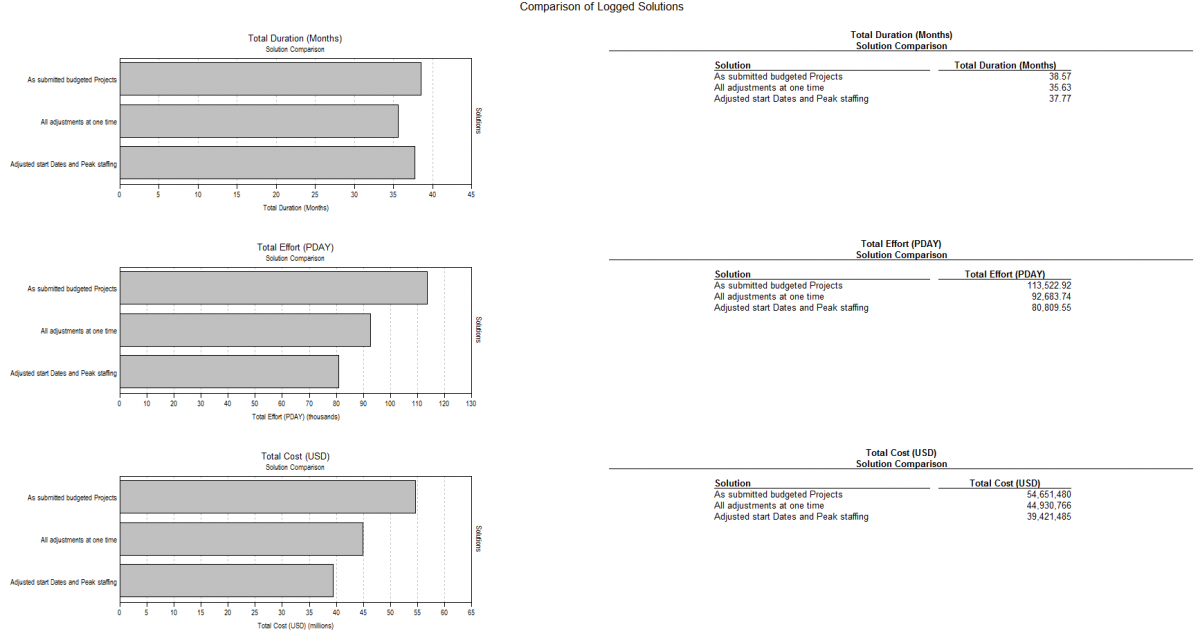
Figure 12. Comparison of "As Submitted" Budget, risk-adjusted, and constraint-adjusted alternatives. Approximately $15 million in savings have been identified in the budget planning process.
Step Five - Matching Skills to Specific Corporate Resources Using the SLIM®-PPM Integration Framework
The SLIM® tooling contains a PPM (Program & Portfolio Management) integration framework. This allows a smooth transition of skill, location, and labor rate data between SLIM® and a corporate PPM System, leveraging the advantages of each tool. For example, SLIM® is particularly good at quickly performing “what-if” analysis to support decision making. When a decision has been made, the skills and effort information can be passed to the PPM system for specific resource assignments, ROI business case analysis, and portfolio analysis. The following figure shows the conceptual model of how the SLIM-PPM Integration works. This integration saves a lot time and effort for project managers who often need to manually input and adjust this data.
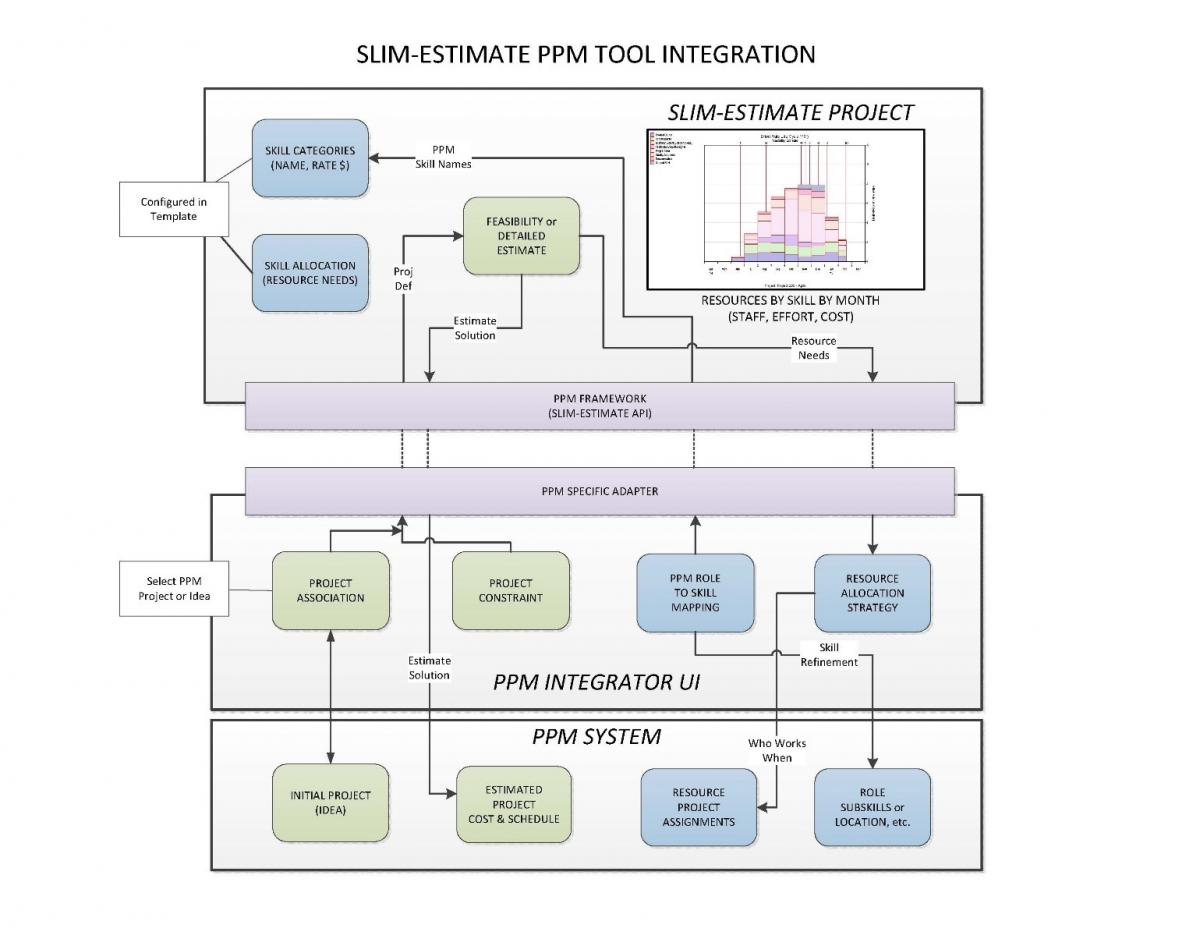
Figure 13. Conceptual diagram of the SLIM-PPM integration
A mature IT budgeting and demand management process can pay huge dividends and is worth considering if you are currently missing the mark or wish to simply maximize or improve the efficiency of your business. In short, implementing the processes and methods described in this paper will help you:
- Identify and eliminate high risk projects that are likely to overrun and slip,
- Identify ultra-conservative projects that are wasteful and opportunities to save big money,
- Identify when to realistically take on new projects,
- Establish realistic total budgets and cash flow projections,
- Identify when specific skills are required to support normal development and be matched to capacity constraints,
- Save time and money by interfacing with a corporate PPM system to streamline resource allocation and portfolio analysis, and
- Quickly evaluate alternatives to meet specific objectives around constraints of money, staffing, or skill mix.