“Watch me make this baby jump,” Ol’ Leadfoot said, as the light on the boulevard turned green. He pressed down hard on the gas pedal. The convertible jerked forward. The tires screamed. The driver in the curb lane cautiously waited till we were far ahead before he proceeded slowly after us. The motorcycle policeman on the cross street looked up.
Ol’ Leadfoot made it to the next traffic light, still red, a good two blocks ahead of the car that had been beside him at the last light. The motorcycle cop was still a block behind us. He had not had enough time to catch our speed.
The companion car reached us just as the light turned green. It inched cautiously past us, pulling over to the curb side of its lane. The cop hung back.
Ol’ Leadfoot pressed the accelerator. “Better take it easy,” I said. “Cop just behind us.”
We have all known Ol’ Leadfoot, particularly in our youth. There is no doubt about it. The power of a jackrabbit start makes the blood tingle. As we begin to pay our own bills, we learn that a screeching start burns up gasoline, several times as much as a more sedate start. Some cars provide a dashboard readout that shows instantaneous fuel usage. A jackrabbit start throws the needle over to maximum burnup, minimum economy.
“We need that software now”
In creative work, too, the jackrabbit approach throws the effort needle over to maximum. “Ready or not, we need that movie now,” the Los Angeles Times headlined. “The studio philosophy is that if you throw enough people and money at a movie, you can pull it together fast. But there’s a big difference between hiring 20 people for 100 days and 100 people for 20 days. . . Making a movie is not like assembling a machine—you need time to reflect.”
“Studios are becoming aware, however, that no one wins if the movie doesn’t work,” the Los Angeles Times continued. “People are realizing that if the picture is good, it doesn’t matter when it is released—and if it is not good, it also doesn’t matter.”
In spite of much history of the folly of rushing creative work, movies still reach the theaters in the state that Barry Diller, former Fox chairman, characterized as “There’s a good movie somewhere in there.”
Like movies, software development is creative and design-intensive. Rushing it burns up resources and saves you little time. Everybody who ever floored a gas pedal in his teens (or made a movie a few years later) knows that.
The software power law
When I (Larry Putnam speaking) developed the software equation—
Size = (Process Productivity) x (Effort) ^1/3 x (Development Time) ^4/3
I had data from the Army Computer Systems Command and several other US Army major commands. Fortunately, the data set was close to homogeneous—batch development, lots of assembly language, some Cobol, no incremental compilers, many development inefficiencies. I didn’t realize it at the time, but the project data all fell in nearly the same process productivity bin.
My key finding was that the product of effort and time produced the software output, as measured in the size of the product. That finding was not surprising. After all, the number of shoes an old-fashioned shoemaker turns out is the product of his effort and time at some productivity rate, shoes per day. The nearly homogeneous data set then led to the two exponents: four thirds on time, one third on effort. Their ratio became the fourth-power law.
The software equation worked in practice, but it is not exact, the way Newton’s laws are. The reason is: the underlying project data is fuzzy, as Newton’s data was not.
From time to time I heard criticism of the four thirds to one third relationship. Other estimating formulas, for instance, either ignored the relationship or gave it a weight of one. That is, in going from a nominal development time to one 25 percent shorter, some methods increased effort by about 25 percent.
By 1984 my company had data on 750 projects, including several hundred commercial projects from the US, Europe, Australia, and Japan. In one study we searched the database for projects that had nearly the same size and the same process productivity, thus duplicating deliberately the pattern of my earlier work. We found three sets. For the three sets the value of the power ratio was 4.166, close to 4.0. The standard deviation was 0.201. However, the number of cases was small, only 23 in all three sets.
In a second study we searched the database for data sets with close to the same value of the ratio between size and process productivity. There were five sets, with from 31 to 76 cases in each set. The average value of the ratio was 3.625 with a standard deviation of 0.148, again close to 4.0.
We were delighted! With the imprecision in the underlying data, we did not expect to get exactly 4.0. Still, with this approach the probability was 84 percent that the true value of the power ratio lay between 3.5 and 4.5.
Alas, several years later, Professor S. D. Conte and his co-authors pointed out that the process productivity we used in this study had itself been determined by the fourth-power law. 1
So, working backward from this process productivity to the power ratio, they were not surprised that it came out near 4.0. We had just proved that a circle is round! Still, the fourth-power law was working in practice. This meant strong tradeoff was there even though we could not prove definitively what its exact relationship was.
Analysis by number of staff
To make a non-circular study, we had to sort the database by some factor that was not tarnished in the first place by calculation from the fourth-power law. We have been advising organizations for years to “use smaller development teams.” We thought small teams made a difference because of the fourth-power law. Why not sort by team size? It is a definite number, derived from client data, regardless of any estimating equations. It reflects what people actually do.
We sorted out two data sets: one using five or fewer people at peak, and one employing 20 or more people at peak. This is clearly shown in Figure 1C, below.
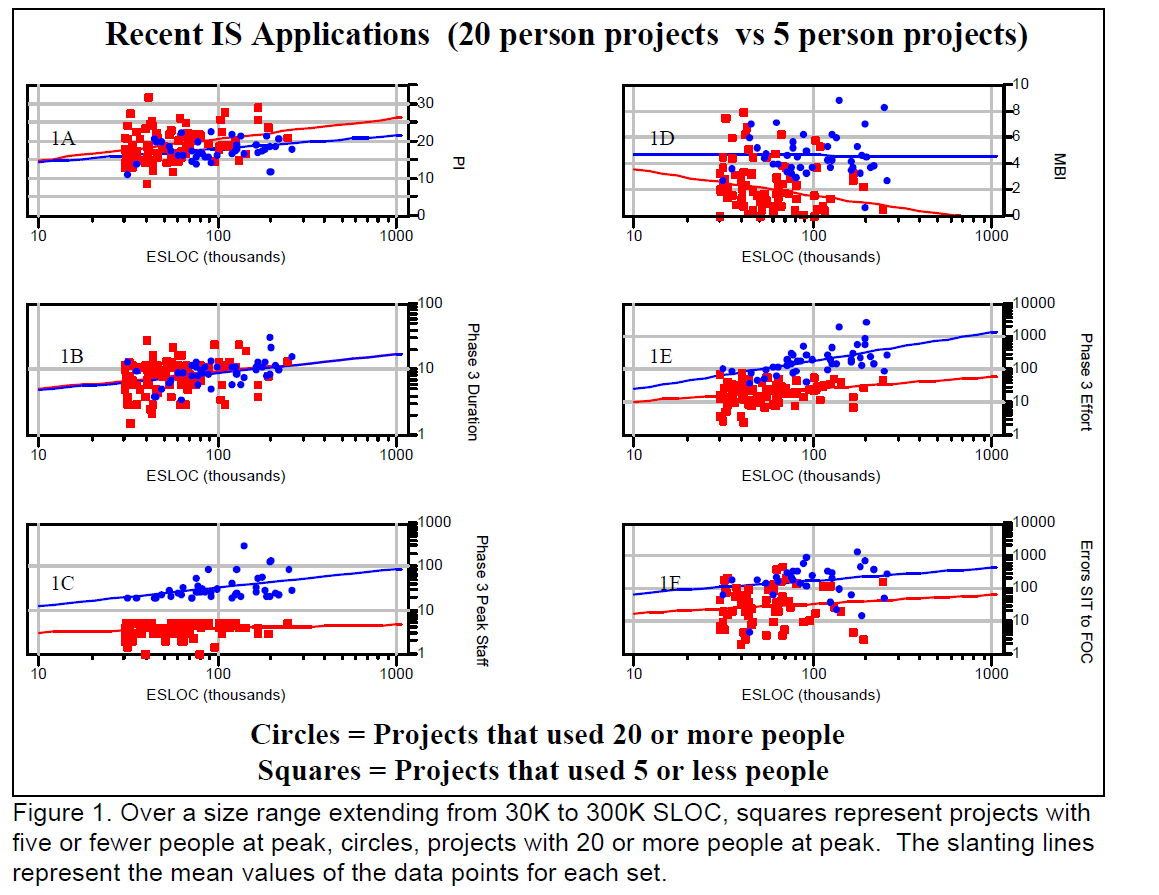
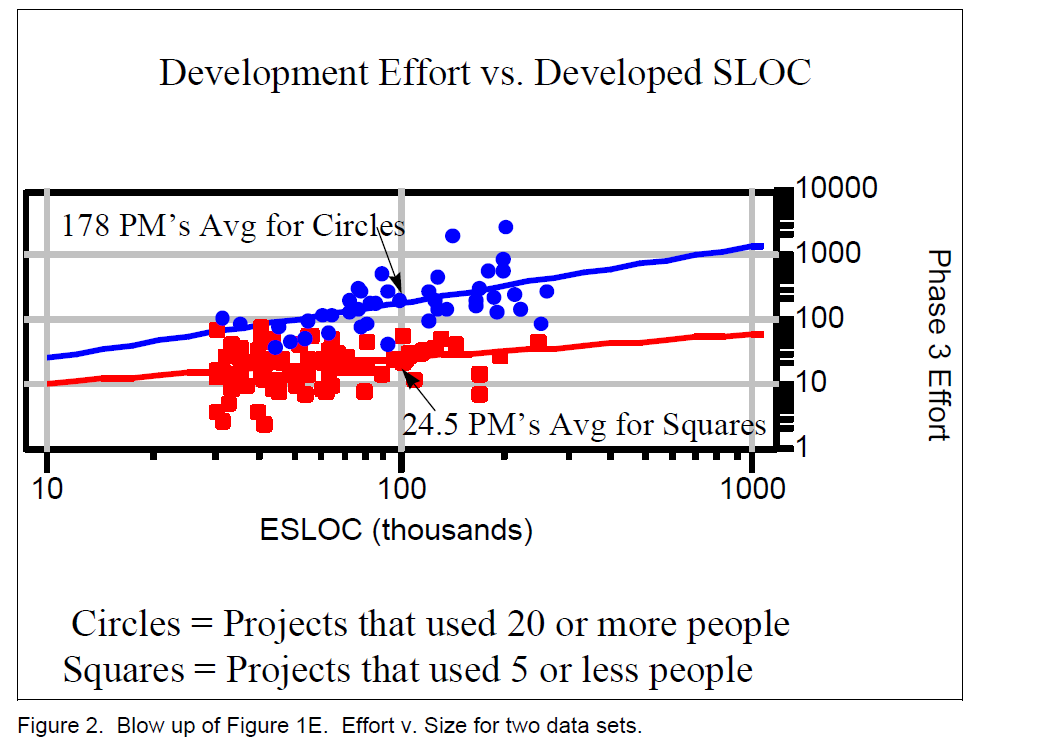
Effort. Let’s look first at the effect of staff size on effort, as shown in Figure 1E and blown up in Figure 2, below. The circles (20 plus people) are clearly on top—much more effort. The trend lines show an average effort in the center of the range (at 100K ESLOC) of 178 person-months for large-staff projects compared to 24.5 person-months for small-staff projects. That is a ratio of 7.3. The ratio is somewhat less for smaller projects (fewer ESLOC) and somewhat more for larger projects.
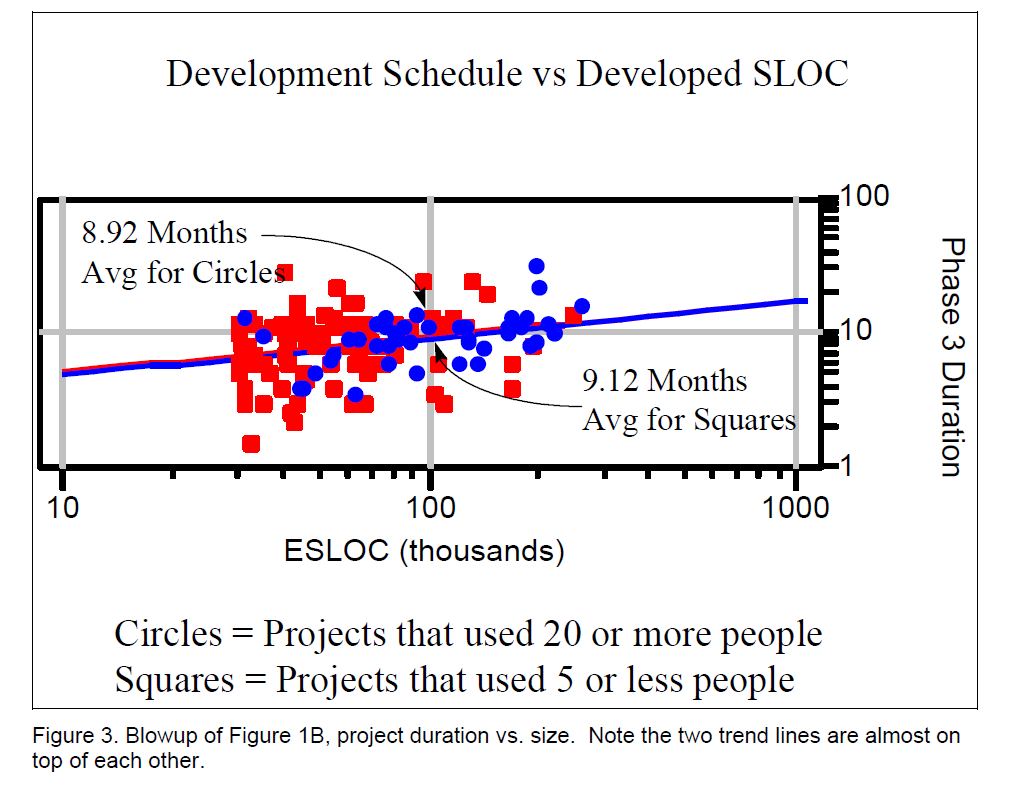
Time. Did that somebody gain much in the form of shortening development time? No, Figure 3 shows the circles and squares intermingled. The trend lines are almost on top of each other, especially at the center of the size range. The trend lines show an average schedule time in the center of 8.9 months for the large-staff projects compared to 9.1 months for small-staff projects. “Somebody” gained 0.2 months for all that effort increase. The time a project takes is very little different whether you use a large team or a small team—you just don’t get much schedule compression
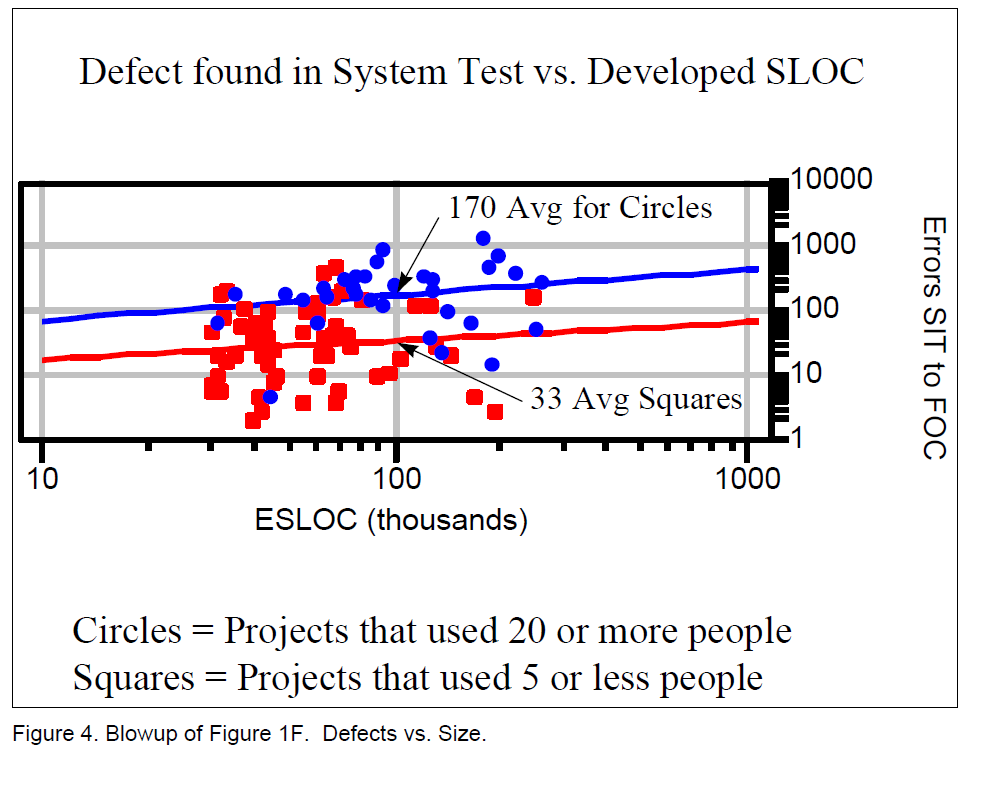
Defects. Well, how about defects? Figure 4 shows that putting all those people on the project generates a lot more defects causing more rework cycles to find and fix them. Not only do the products built by the larger teams cost more effort and dollars, they eat up any schedule benefits in rework.
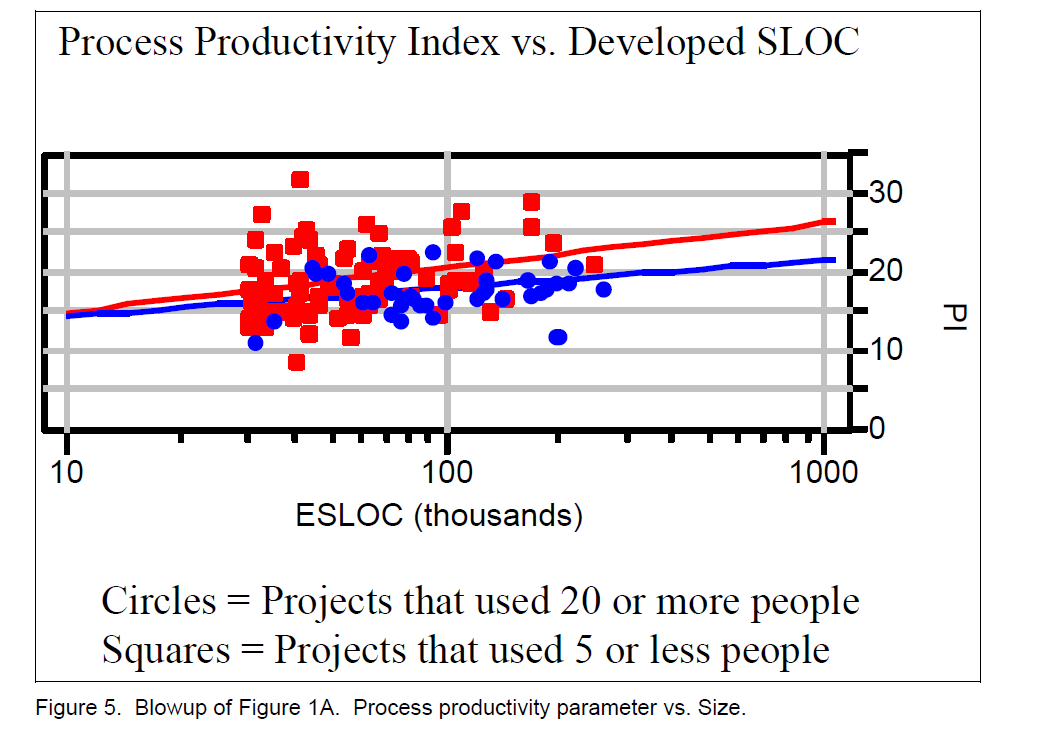
Process productivity. In Figure 1A the trend lines show that projects with 20-plus staffs are substantially less effective (in terms of the process productivity index) than projects with 5-minus staffs. That is, for the same size project, large teams generate a smaller process productivity index than small teams -- they are less efficient. Figure 5, below, shows this pattern.
Tradeoff still powerful
Our 1984 study showed that the effort-time tradeoff varied over a range around a power ratio of 4. This variation is the result of fuzzy project data. Our current study, using staff size as the criterion, shows a marked difference in effort, little difference in schedule. This finding verifies that there is a tradeoff and it is large, but it doesn’t say whether it is 3 or 5. We do think it is in that range. The fact that it is a lot more than 1.0 is the important point. You can trade off a little more development time for a lot less effort, cost and defects—within limits, of course.
Remember, go light on that gas pedal. Or, if you are a film buff, take time to find the good movie out of all that footage you shot!
- 1. S. D. Conte, H. E. Dunsmore, and V. Y. Shen, Software Engineering Metrics and Models, The Benjamin/Cummings Publishing Co., Menlo Park, CA 1986, 396 pp.