October 2014

October 2014

What Software Project Benchmarking and Estimating Can Learn from Dr. Seuss

Software Estimation and Dr. SeussSoftware project benchmarking and estimating leverages the power of historical project data to do solid project estimates, yet the concepts behind such processes are often not well understood.  Benchmarking and estimating rely on productivity comparisons with completed (actual) projects in a historical database and on parametric equations that mimic real life.  I find that technical concepts such as software estimation or benchmarking often can be explained by using analogies that work in other industries.  As I was thinking about benchmarking and estimating this week, the popular children’s book, Dr. Seuss's Green Eggs and Ham, came to mind.

I was talking about data mining, benchmarking, and the SLIM Suite of software estimating tools with QSM’s research director, Kate Armel. It seems that many project estimators believe that creating microscopic slices of project data is the key to precision in estimating and benchmarking, when, in reality, bigger chunks of data take less time to assemble and provide greater value.  Projects are never exact duplicates of each other, however, there are valuable trends and patterns that come out of a few common characteristics.

Blog Post Categories 
Benchmarking Estimation

Probability, Baseball, and Project Estimation

How is baseball analysis like software project management?  One way is the ability to continually update estimates and forecasts, as the situation and our knowledge change.  As Larry Putnam Jr recently wrote, “project estimation should continue throughout the entire project lifecycle”. 

Walter Shewhart, the father of Statistical Process Control, explained it like this:

“…since we can make operationally verifiable predictions only in terms of future observations, it follows that with the acquisition of new data, not only may the magnitudes involved in any prediction change, but also our grounds for belief in it.”

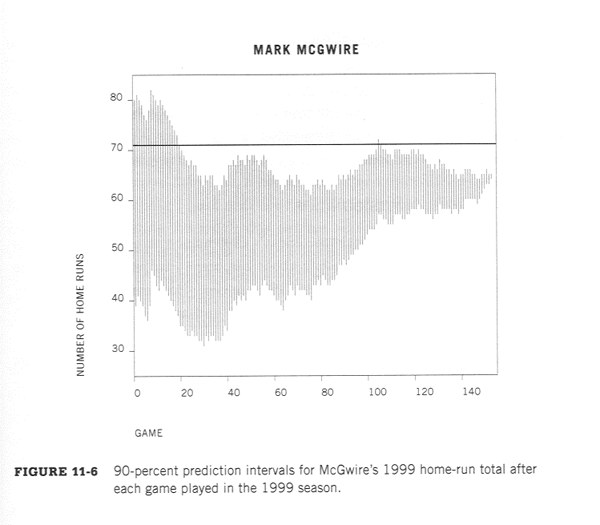
Here is a baseball example that should appear very familiar to software estimators who are familiar with the often quoted cone of uncertainty.  The following graph is taken from Curve Ball: Baseball, Statistics, and the Role of Chance in the Game, by Jim Albert and Jay Bennett.

Baseball Software Project Probability

The above model is based upon only a few simple items:  The number of homeruns hit so far; the number of games played so far and number remaining; and the total number of games in a season.  We could try to improve the model, especially early in the season, by incorporating more information.  For example:  

Blog Post Categories 
Estimation Data Project Management

New Article: Estimate Before, During, and After the Software Project

Estimate Before, During, and After the Software Project

A common misperception is that an estimator’s job is done after a software project’s parameters are set. On the contrary, software estimation should be conducted throughout the project lifecycle to reflect inevitable changes and to improve estimates on other projects. In this article, originally published in Projects at Work, Larry Putnam Jr. identifies three ways to maximize estimating efforts — before, during and after your project is complete.

Read the full article!

Blog Post Categories 
Estimation Articles PPM

From Proposal to Project Webinar Replay and Q&A Highlights

From Proposal to Project: Getting Resource Demand Early

QSM's recent webinar, From Proposal to Project: Getting Resource Demand Early, presented by Andy Berner and Keith Ciocco, featured a thoughtful Q&A session from our audience. Here are the highlights:

Q: Which PPM products does SLIM work with right now?

A: We're working with customers to see what products they're interested in. It's adaptable to multiple PPM systems and we'd like your input on which ones we should deliver for you early. We can work with you so you can build a customized input to your own system. So the framework is very general and is released as part of the SLIM product. We will be providing adapters to common PPM systems and that's what we would like to learn from our design partners - which ones to deliver first. (Note: if you are a SLIM customer or prospect, you can request to join our design group by emailing Keith Ciocco).

Q: You showed SLIM-WebServices. Does that come with the desktop tool? Do you use them separately or together?

The "Typical Software Project" Over Time

What does a typical software project in the QSM historical database look like, and how has “what’s typical” changed over time? To find out, we segmented our IT sample by decade and looked at the average schedule, effort, team size, new and modified code delivered, productivity, language, and target industry for each 10 year time period.

The QSM benchmark database represents:

  • 8,000+ Business projects completed and put into production since 1980.
  • Over 600 million total source lines of code (SLOC).
  • 2.6 million total function points.
  • Over 100 million person hours of effort.
  • 600+ programming languages.

During the 1980s, the typical software project in our database delivered 154% more new and modified code, took 52% longer, and used 58% more effort than today’s projects.   The table below captures these changes:

Blog Post Categories 
Team Size Languages QSM Database Effort