November 2013

November 2013

Webinar - Function Point Analysis Over the Years

We are pleased to announce our upcoming webinar, Function Point Analysis Over the Years, presented by Don Beckett on Thursday, Dec. 5 at 1:00 PM EST.

Function point analysis has played an important role in software measurement and analysis for 30 years. What can we learn from trends spanning this substantial time period? What does the "average software project" look like? Has productivity increased or decreased? What are the impacts of different staffing strategies? In this webinar, QSM's Don Beckett leverages more than 2,200 validated projects counted in function points and completed since the year 2000 from the QSM historical database to answer these questions. It is easy to have opinions about any of these questions. QSM is fortunate to be able to evaluate them empirically. Please join us for a metrics-based analysis of these questions and more.

Don Beckett has 18 years of experience in software project estimation, measurement, and analysis. His responsibilities at QSM include research, consulting, and customer support. Don was an analyst/co-author of the 2006 QSM Software Almanac and has contributed articles to Crosstalk and Software Tech News.

Watch the replay!

Blog Post Categories 
Webinars Function Points

Ask Carol: No Matter What, in Project Management, Size Matters

QSM will be hosting a new free advice column for software professionals who seek help to solve project management, communication and general software project issues. The first few scenarios are based on questions we receive all the time. Carol Dekkers is a QSM consultant and IT measurement and project management expert who speaks internationally on topics related to software development. Send your questions to Ask Carol!

Dear Carol: 

I’m a systems analyst working for a telecom company and I have several projects on the go at the same time.  Our PMO (Project Management Office) told us that now we have to start tracking the size of our projects both at the beginning and at the end.  I can’t believe this – it’s just more metrics and (redundant) data.  I already track project size because I do time reporting (by project) and all they need to do is add up my hours at the end and voila, you’ve got the project size: the more hours it took - the bigger the project.  They don’t seem to get it and I’ve asked for an exemption from this overhead task. Their response was to enroll me in a two day sizing course!  What can I do to prove to them that they already have the size because I keep track of my hours? 

- Frustrated in Seattle

Dear Frustrated:

Blog Post Categories 
Sizing Ask Carol

How to Customize SLIM Charts to Make Them Presentation-Ready

Think of a time when you gave a presentation that did not go well.  Was the actual content of your presentation subpar, or was it that something lacked in the delivery?  More likely than not, your answer was the latter (after all, why would you present something if it wasn’t worthwhile?). 

When putting together a presentation, I’ve found that the overall aesthetics can drastically impact how your message is received.  Seemingly small things, such as displaying a graph that uses clashing colors or an undesirable font can sometimes overshadow the content you are trying to deliver.

In her recent blog post titled Customizing SLIM-Suite Workbooks, Katie Costantini discussed how the default workbooks in SLIM-Estimate, SLIM-Metrics, SLIM-MasterPlan, and SLIM-Control can be customized.

I applied the techniques outlined in her post to one of the Sample Files to give my presentation slides a more modern look and feel.  Below is a ‘Before and After’ view of a sample SLIM-Metrics Workbook View. 

Before:
Before

After:
After

Blog Post Categories 
Tips & Tricks

Fundamentals of Software Metrics in Two Minutes or Less

A couple of years ago at a lean software and systems conference, I delivered a “lightning talk” about software metrics. In the two-minute time span, I illustrated the folly of gathering data without a measurement plan and the audience grasped the concept immediately.  “Why don’t more companies get this?” remarked several attendees, “it just doesn’t make sense to collect all the data we do without a plan.”

It doesn’t take a rocket scientist to succeed with software measurement; professionals with a straightforward plan can quickly and easily reap its benefits. Two concepts are fundamental to embrace for metrics success:  1. Goal-Question-Metric (GQM), and 2. Simplicity.  

Goal-Question-Metric (GQM) Approach to Metrics

First introduced by Victor Basili as an approach to measurement, and later the subject of a book by the same name by Rini vanSoligen and Egon Berghout, GQM is a straight-forward, stepwise approach to measurement.  While it has applicability to measurement in any industry, Basili created GQM specifically to address the chaos in the software world.  GQM involves three steps:

  1. Establish the Goals for measurement.
  2. Ask the Questions that will answer whether the goals are being met.
  3. Design and collect the Metrics to answer the questions.

The Software Engineering Institute (SEI) at Carnegie Mellon University in Pittsburgh, PA expanded Victor Basili’s GQM approach to GQIM, the “I” being indicator, but that is the topic of a future post.

Blog Post Categories 
Metrics Database

The Laws of Software Staffing

Frederick Brooks famously said that adding staff to a late project only makes it later.  The reasons are readily apparent.  The project is already experiencing difficulties, most of which were not caused by understaffing.  The usual culprit is an unreasonable schedule constraint; but starting work before the requirements were well defined, poor change control, or weak configuration management could also be the villains (or at least play a contributing role).  None of these root causes is staff related and adding staff does not fix them: it merely adds more bodies to the confusion.

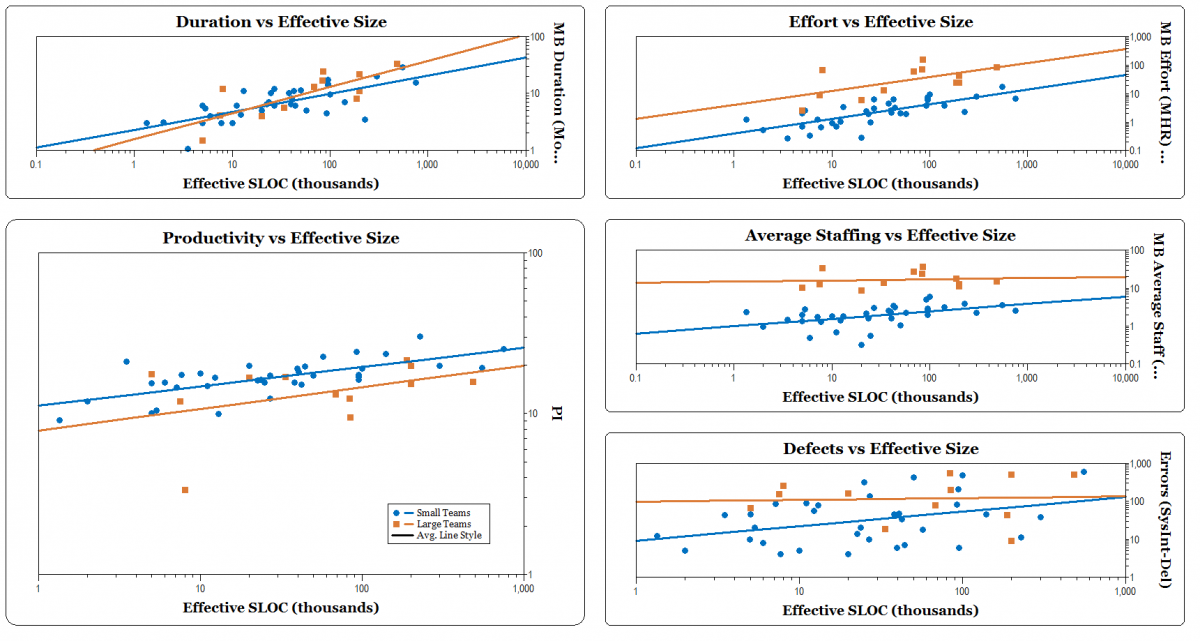
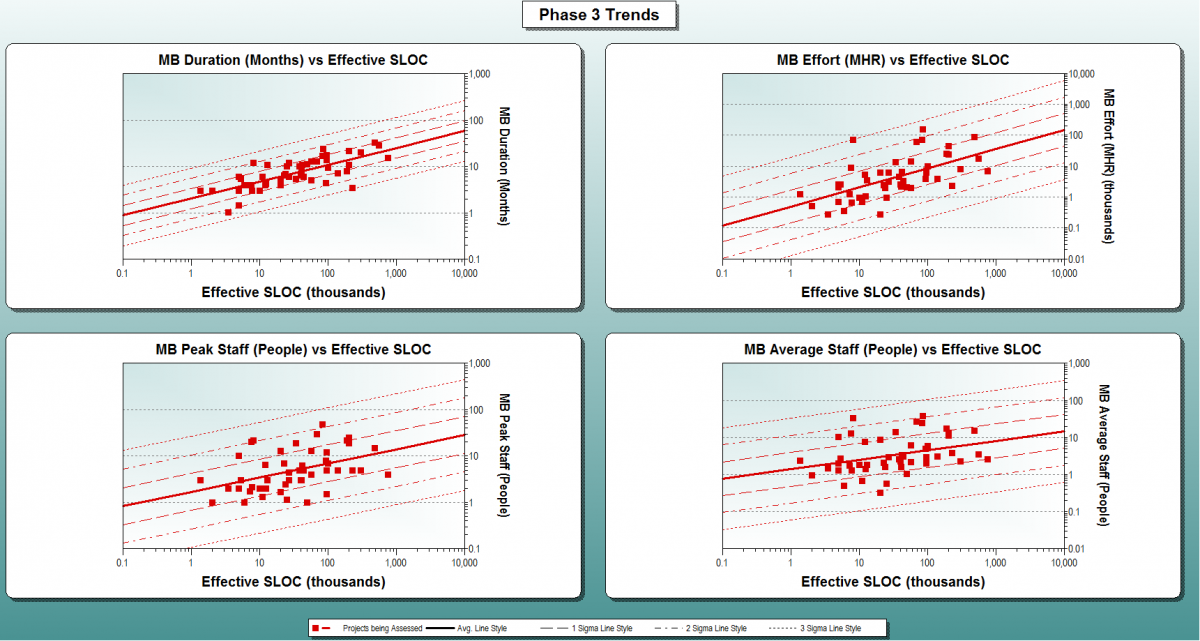
But, how do we determine the most appropriate staffing profile for a software project?  Parametric estimation models suggest a way: these models have determined that there is a relationship between the functionality that a project delivers (called size in the software estimation vernacular) and staff.  Fitting a regression line through hundreds or thousands of software projects determines an average and deviation from that average. The regression is a reflection of how software projects have performed.  This is what has worked.  This capability is built into estimation software like SLIM-Estimate.  A wise approach is to take the average as a starting point, then adjust the modeling parameters that would increase or lower the staff.  A word of caution here: if you find that your adjustments cause staff, effort, or duration to be more than 1 standard deviation above or below average, you are probably being either too optimistic or pessimistic.  Don’t do it! 

Blog Post Categories 
Team Size